
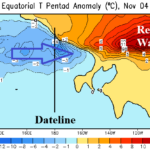
Super El Nino Peaking. Expecting Rapid Demise During Early 2027.
11/10/2026, 8:40 am EST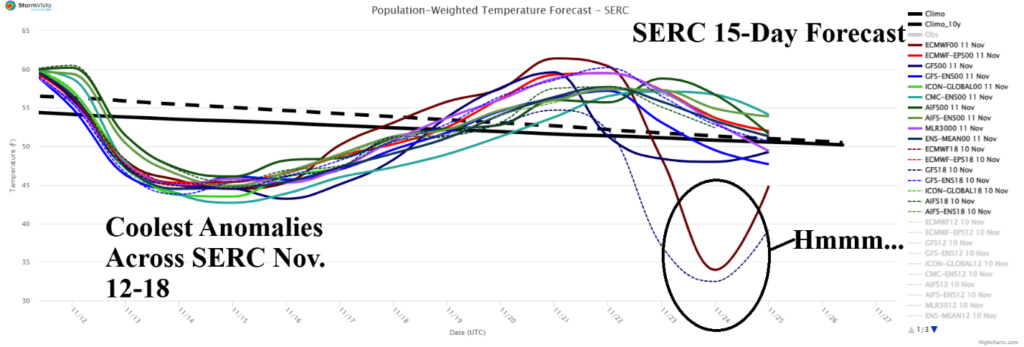

Climate Impact Company Daily Feature
Issued: Wednesday November 11, 2026
Highlight: Explaining the natural gas price rise.
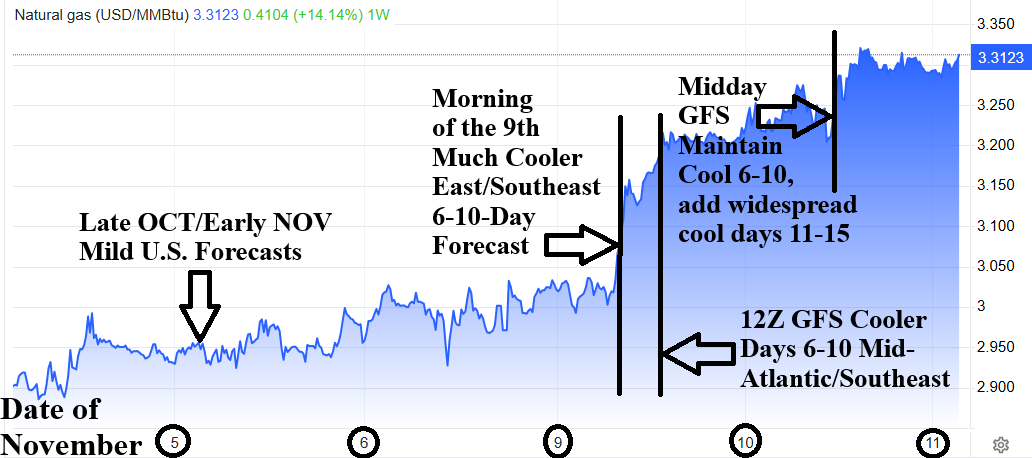
Fig. 1: An explanation as to why natural gas prices increased this week related to weather forecasts.
Discussion: Generally, a cooler/colder 6-10-day forecast change across the high population/high heating demand East U.S. will cause natural gas prices to rise (Fig. 1). Once a pattern change for a key region is agreed upon by forecast models during the 6-10-day period, the outlook is considered reliable and triggers a chain reaction across natural gas supply, demand, and storage levels.
Departing October and entering November Super El Nino-inspired warm forecasts prevailed leaving natural gas prices low although showing a slight rise due to market-speak of sudden stratospheric warming (SSW) and the attendant cold weather SSW events can generate. On Monday morning, the 9th of November, chilly 6-10-day forecasts were issued during the morning for the Mid-Atlantic/Southeast U.S. (Fig. 2). An additional price rise occurred following a cooler trend forecast by the 12Z GFS for the same region (Fig. 3). Another price rise was generated by steady chilly 6-10-day forecasts at midday yesterday (Fig. 4) but adding a (GFS) widening chill for the 11-15-day period (Fig. 5). Market prices are steady this morning, at the higher levels, and should remain so until a warmer 6-10-day forecast appears.
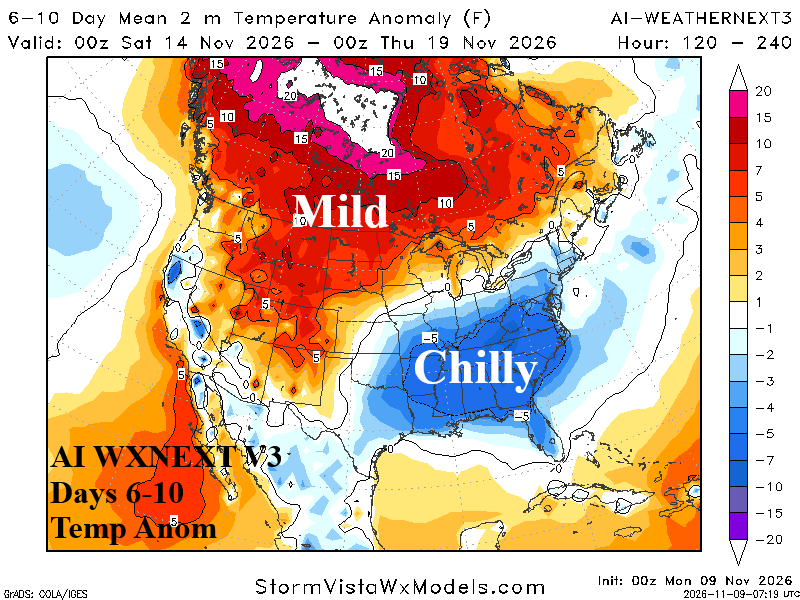
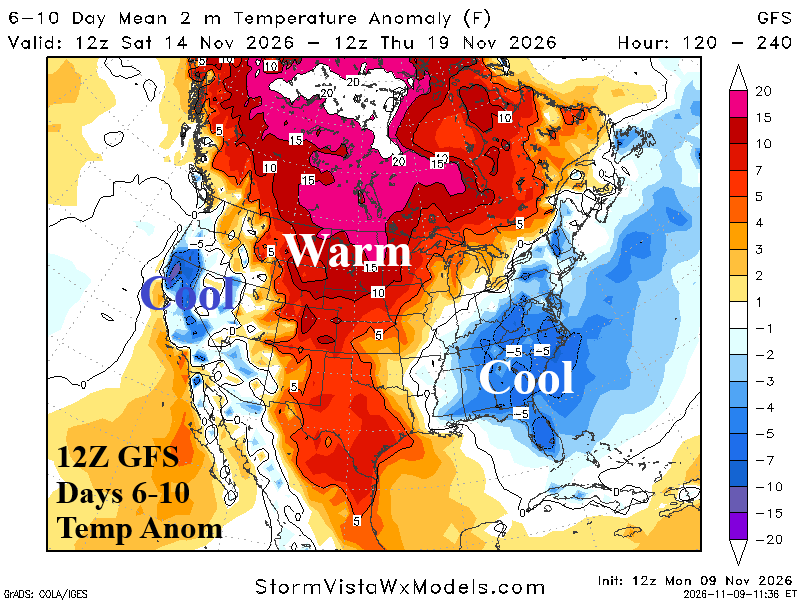
Fig. 2-3: The Monday morning 6-10-day forecast utilizing AI WXNEXT V3 and the midday Monday 12Z GFS 6-10-day outlook.
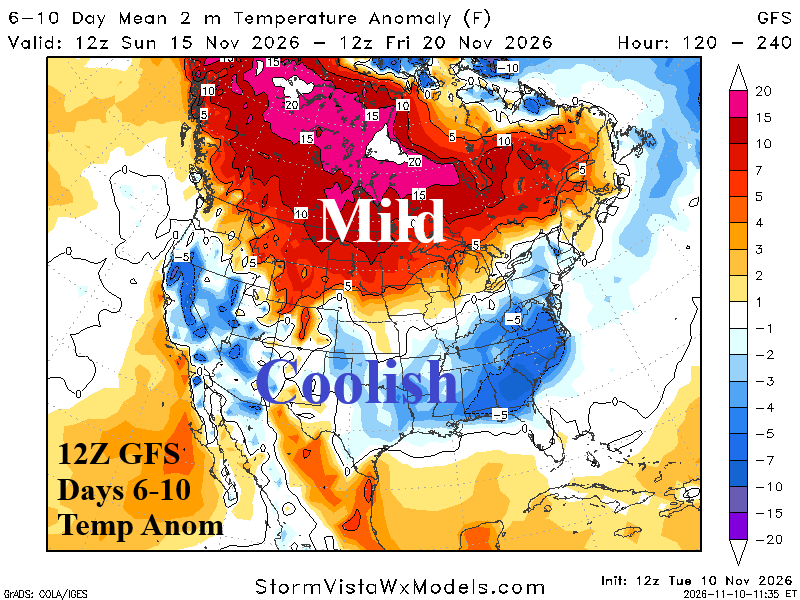
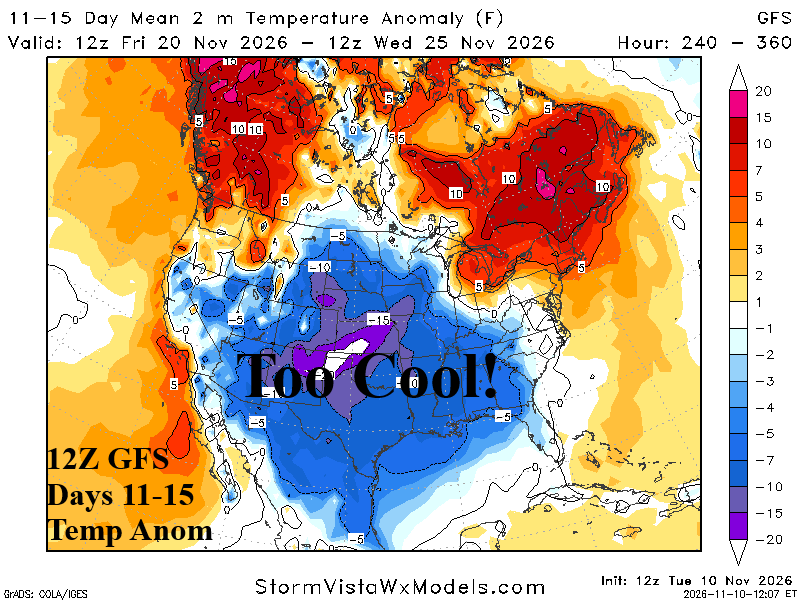
Fig. 4-5: The midday 12Z GFS 6-10-day and 11-15-day U.S. medium range temperature anomaly forecasts.
Overnight, what drove higher natural gas prices remains true…a lengthy chilly period for SERC (Fig. 6) which includes PJM-East (Fig. 7). While a warm-up follows the weekend/next week chill, on day-15 natural gas traders will suspect (more) cold brewing potential beyond day-15 due to cooler trends for both regions indicated late in the 11-15-day period. What is the risk that chilly weather could regenerate in the East after day-15? The mega-cluster ensemble indicates a 26% risk of a chilly trough in the East (Fig. 8). The risk of regenerating warm high pressure is 62%. There is one climate signals supporting the potential for regenerating chill. Negative phase of the East Pacific oscillation (-EPO) is forecast for Nov. 18-26 (Fig. 9). The -EPO pattern is the “polar vortex” climate signal. However, most climate signals and extended-range forecasts are mild.
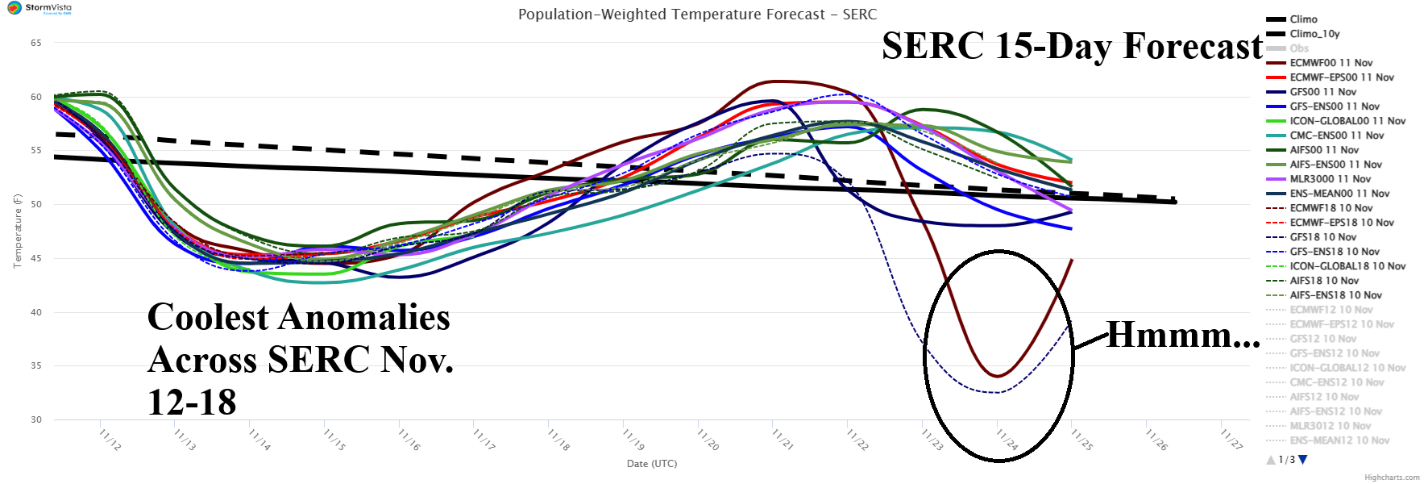
Fig. 6: The SERC 15-day population weight daily average temperature forecast.
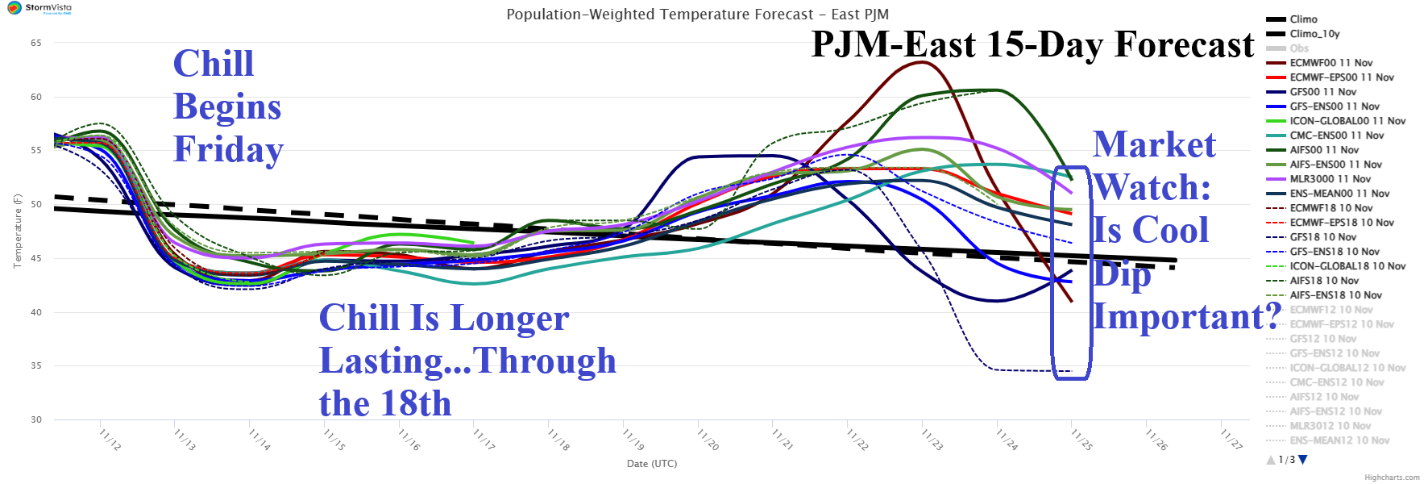
Fig. 7: The PJM-East 15-day population weight daily average temperature forecast.
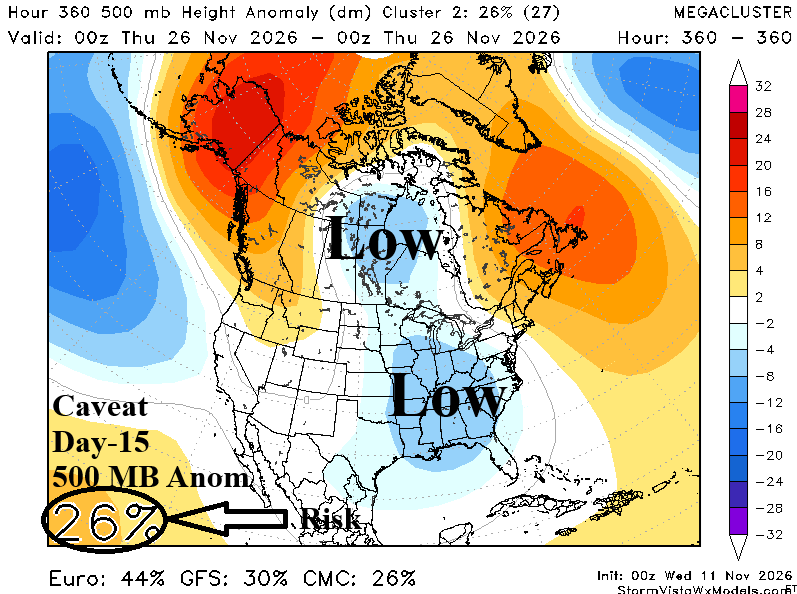
Fig. 8: Mega-cluster ensemble 500 MB anomalies “caveat” forecast for day-15 with 26% chance of occurrence.
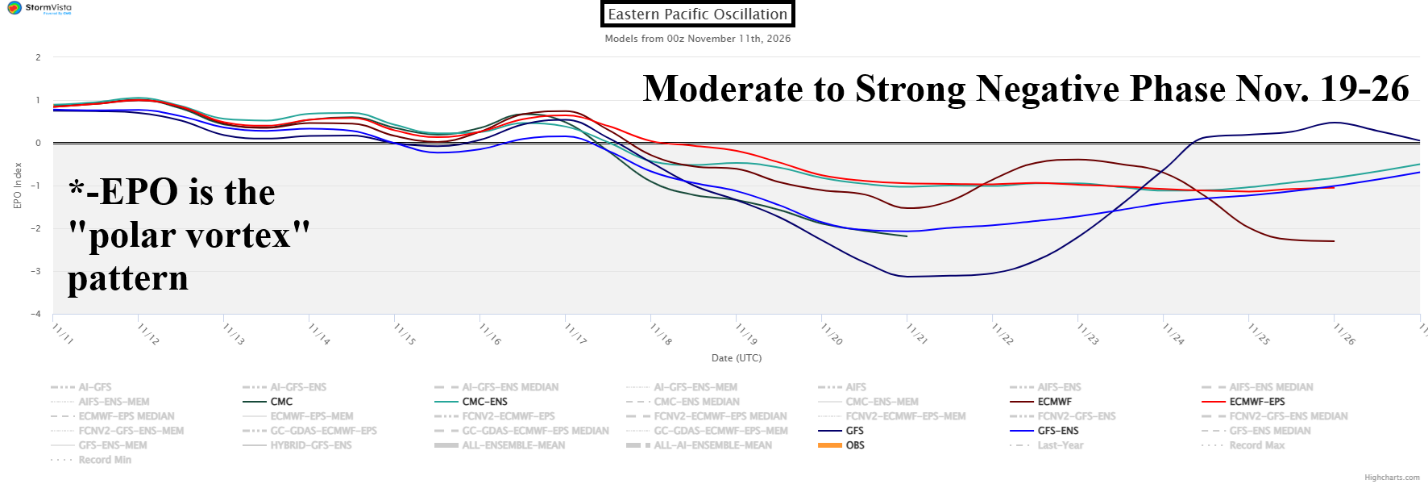
Fig. 9: East Pacific oscillation 15-day forecast utilizing all operational models.