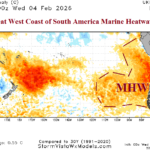
The Great West Coast of South America Marine Heatwave
02/05/2026, 4:06 pm EST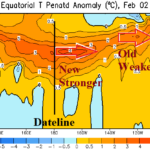
Subsurface Equatorial Pacific Looking El Nino-like; Surface and Atmosphere Linger La Nina
02/09/2026, 11:29 am EST

![]()
Climate Impact Company Sunday Report
Issued: Sunday, February 8, 2026
Highlight: The next weather (and climate) problem in the U.S.; -PNA driven storminess.
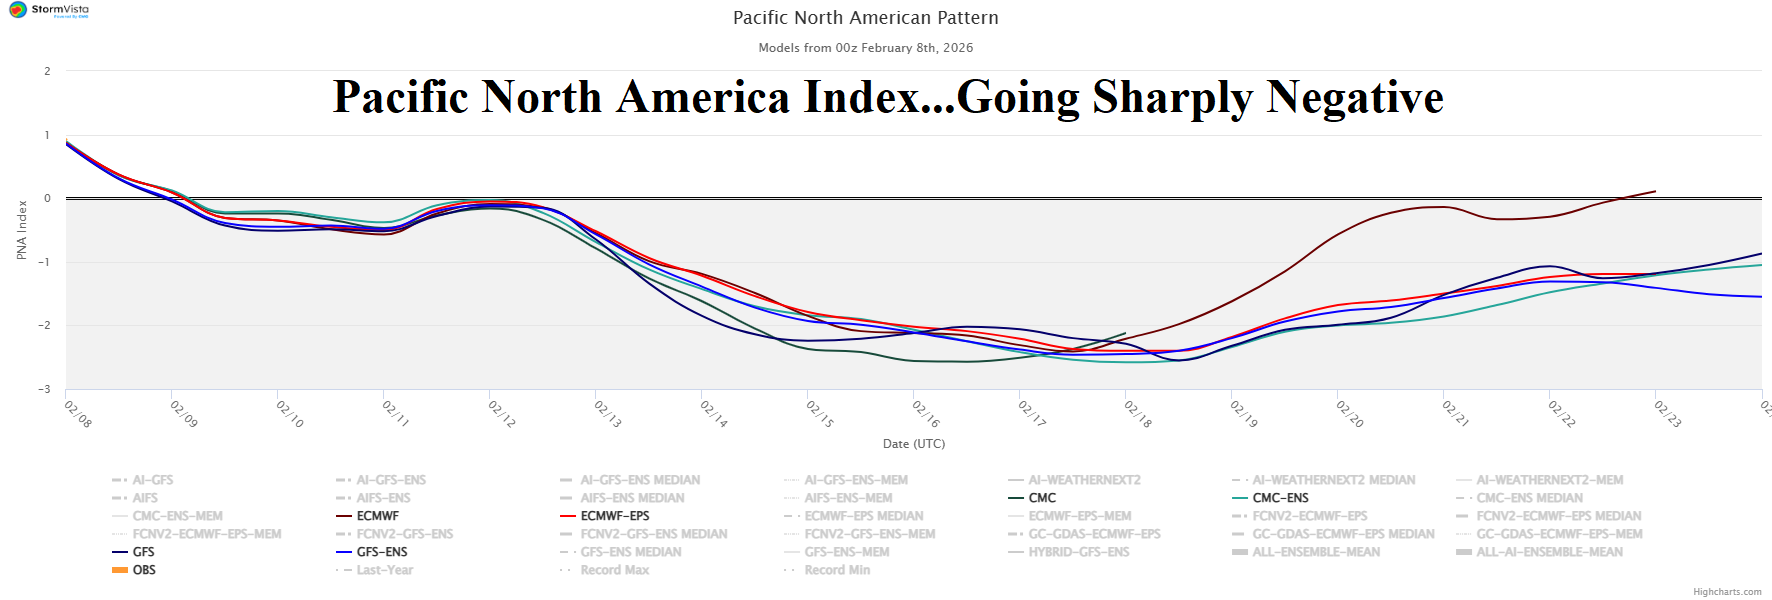
Fig. 1: The 16-day Pacific North America index forecast.
Discussion: A transition into moderate-to-strong negative phase Pacific North America (-PNA) index develops later this week and lasts through the remainder of February (Fig. 1) and may continue in March. The -PNA shifts the focus of U.S. weather hazards from cold to stormy. The pattern evolves in the 6-10-day period as GFS and ECM equally combine to produce a stormy forecast across the West including a large area of snow plus heavy snow in the Upper Midwest U.S. and heavy rain in the Mid-south States (Fig. 2). In the 11-15-day period, storminess including heavy snow continues across the West with heavy snow in Ontario/Great Lakes/New England and heavy rain in the Tennessee Valley (Fig. 3). The stormy pattern lingers in the extended range in the Northwest U.S., Midwest, and Southeast States (Fig. 4). ECM and CFS V2 maintain a -PNA pattern during March (Fig. 5-6) supporting potentially additional heavy precipitation in the Mid-south U.S. (and vicinity). The last of the extreme cold to start the week in the Northeast U.S. where daily records are possible in both the PJM-East/NEPOOL electric reliability zones (Fig. 7-8). Moderation follows for mid-to-late February although deepening Northern U.S. snow cover may help to regenerate cold later in the month. The U.S. population weight HDD forecast identifies the national decline in heating demand next week potentially returning to near or colder than normal late FEB/early MAR (Fig. 9-10).
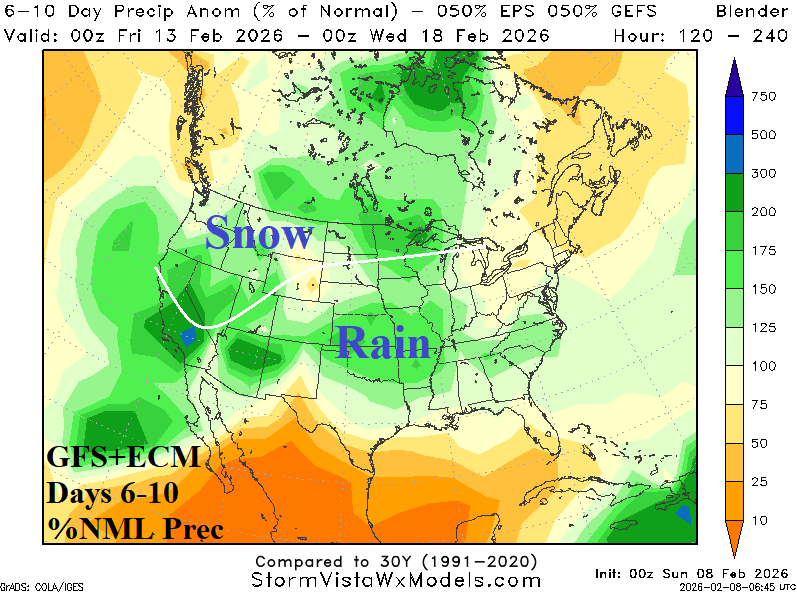
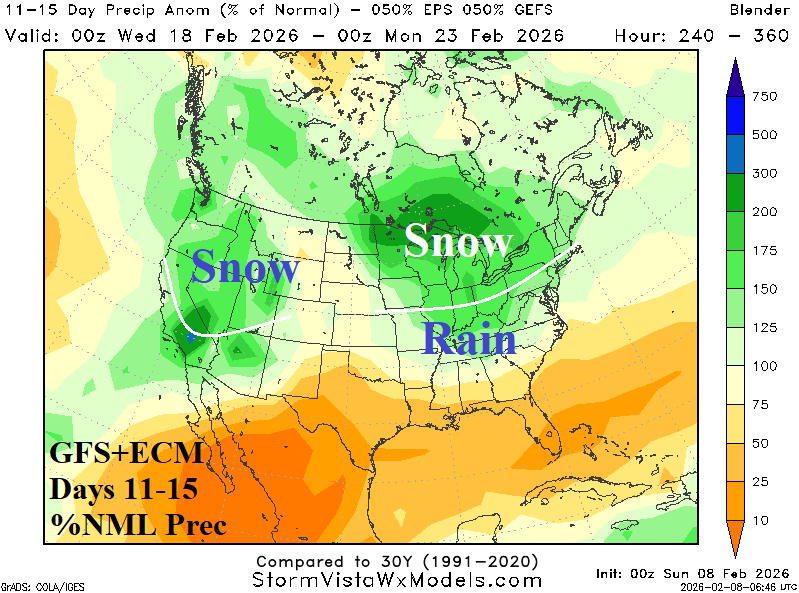
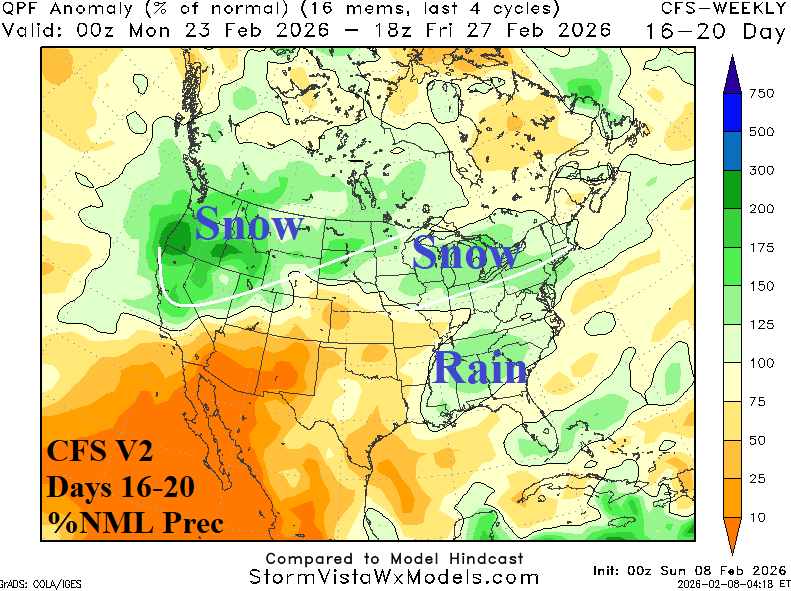
Fig. 2-4: The GFS+ECM 15-day percent of normal U.S. precipitation forecast.
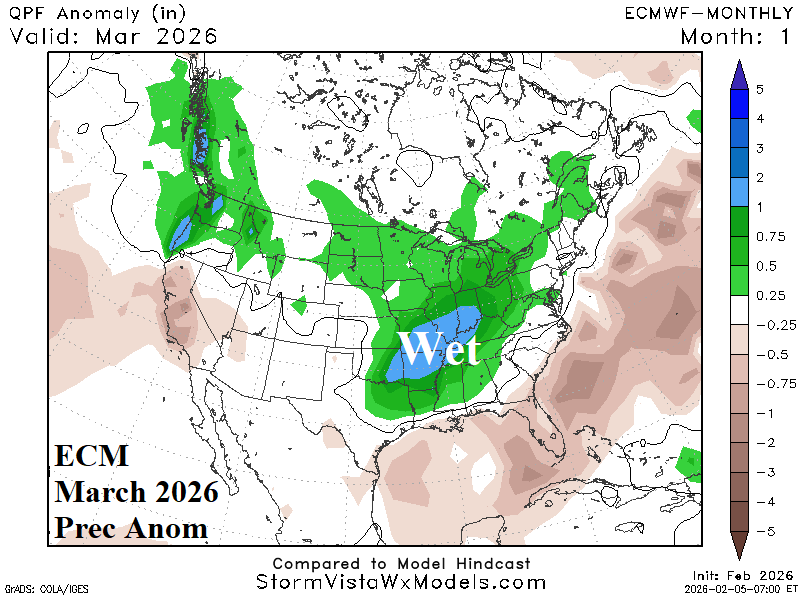
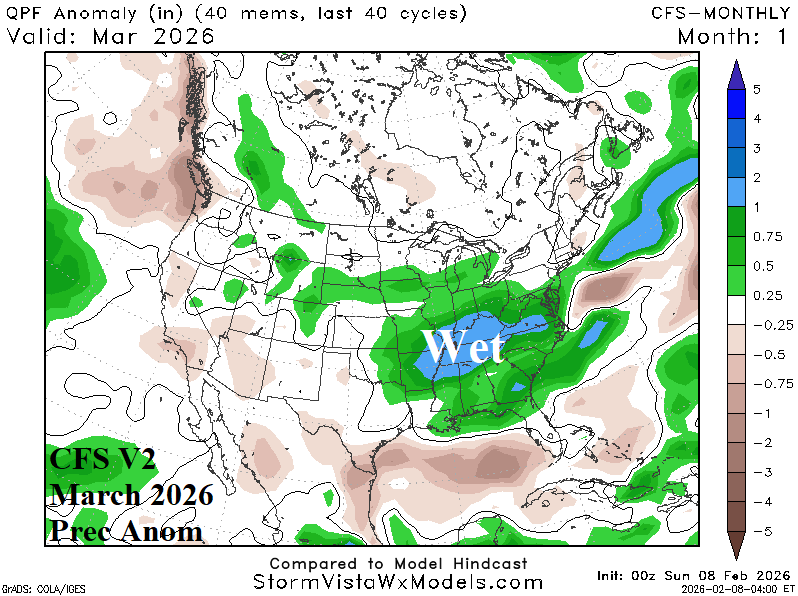
Fig. 5-6: The ECM and CFS V2 precipitation outlook for the U.S. during March 2026.
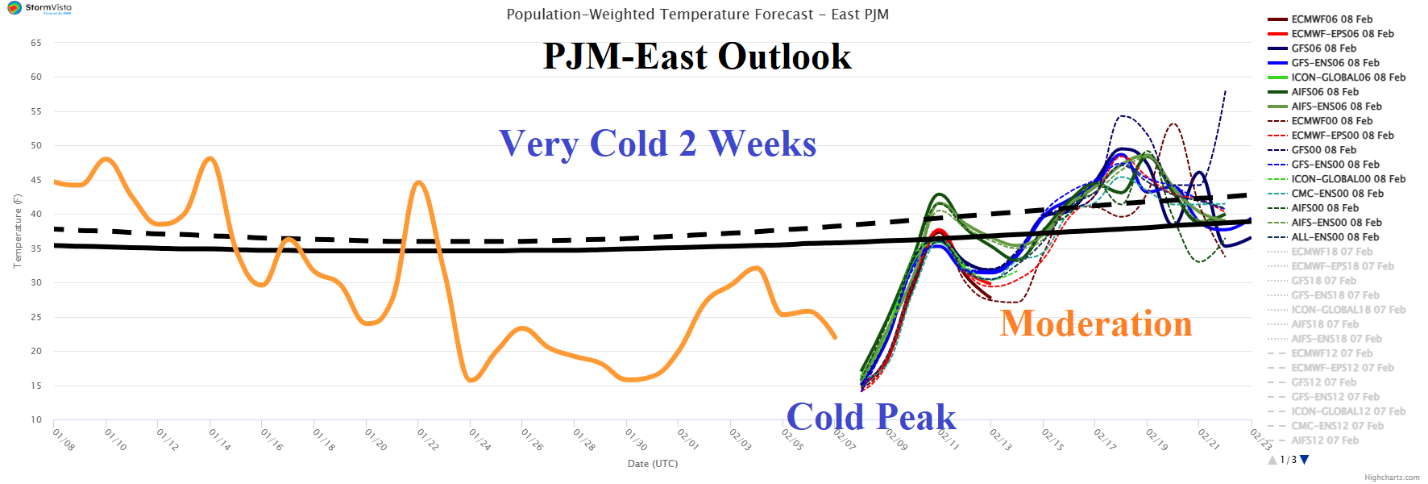
Fig. 7: The PJM-East 15-day daily average temperature forecast.
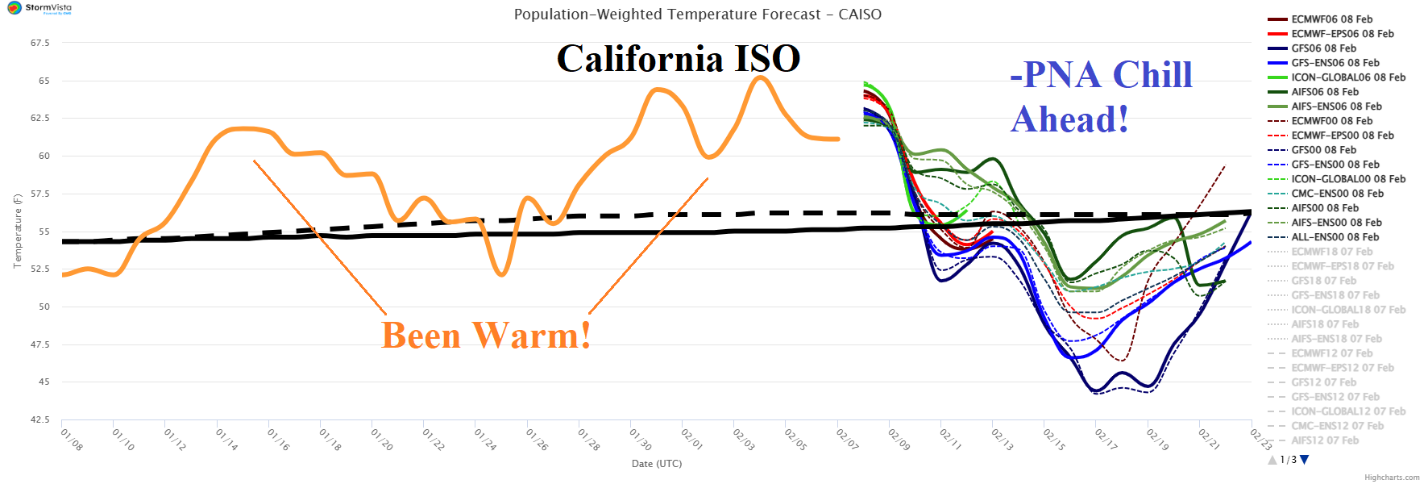
Fig. 8: The CAISO 15-day daily average temperature forecast.
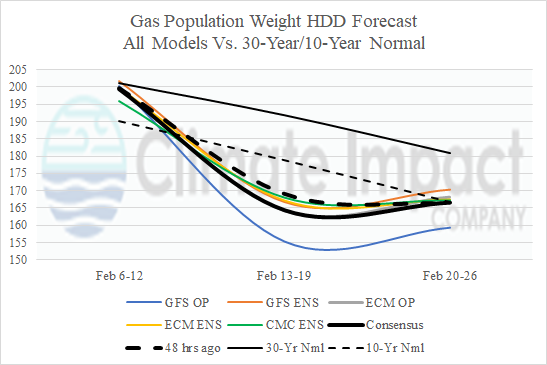
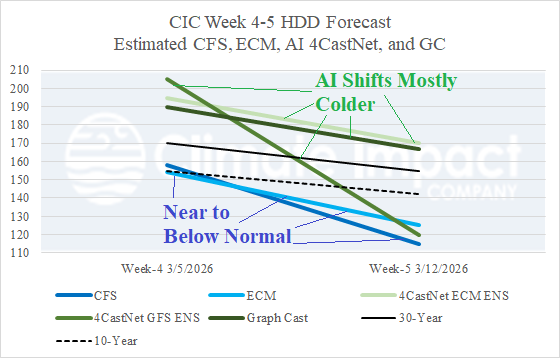
Fig. 9-10: U.S. gas population weight HDD forecast utilizing all models through February and estimated HDD for week 4-5 ahead.