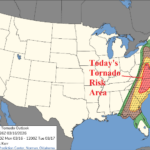
Severe Weather and Tornado Risk Mid-Atlantic States Today
03/16/2026, 5:27 am EDT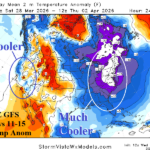
12Z GFS MUCH COLDER East U.S. Days 11-15
03/18/2026, 1:41 pm EDT
Climate Impact Company Early U.S. Notes
Issued: Tuesday March 17, 2026
Highlight: How the Hawaiian “Kona Storm” shaped the March 15-16 severe weather and following warm/dry pattern.
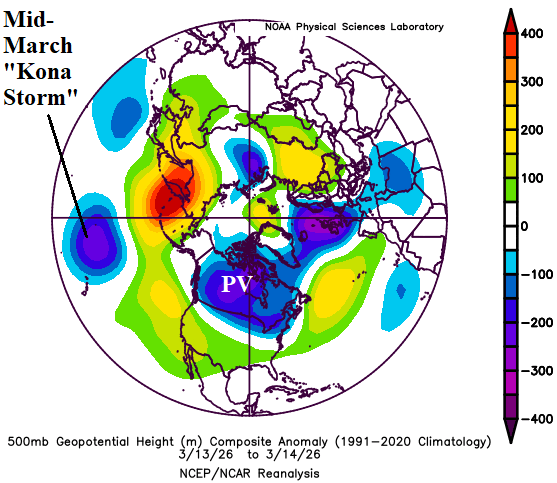
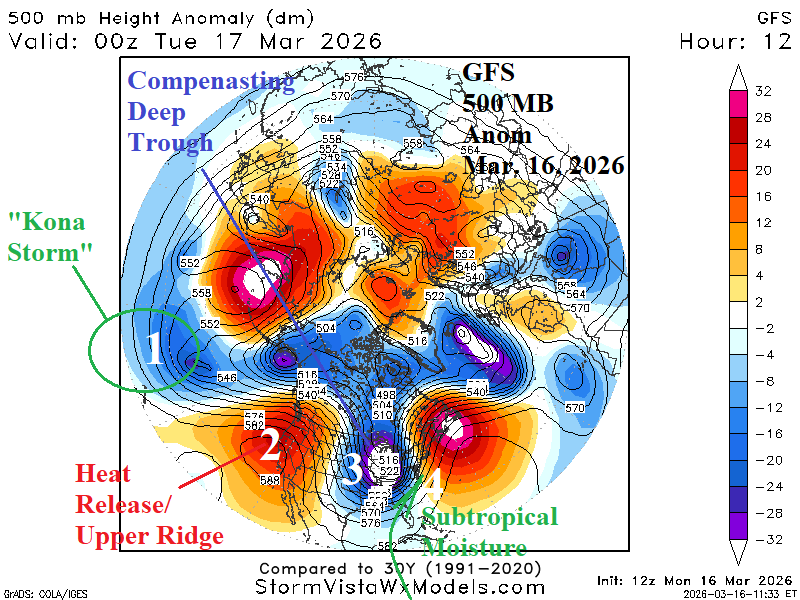
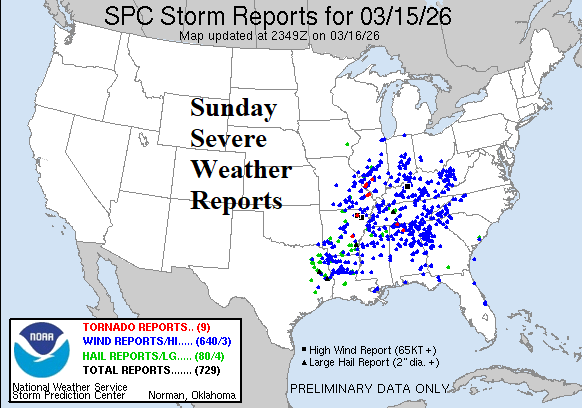
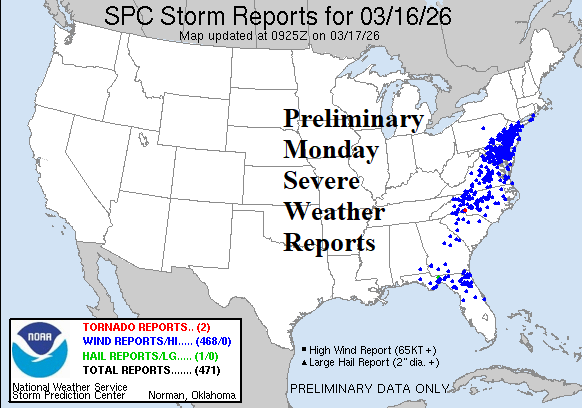
Fig. 1-4: Mid-March northern hemisphere upper air pattern identifying the connection between the Hawaii “Kona Storm” and March 15-16 severe storms.
Discussion: As the middle third of March arrived, a large low-pressure area formed northwest of the Hawaiian Islands (Fig. 1) causing the trade winds to reverse to the southwest direction across Hawaii bringing very humid and thundery weather causing widespread flooding. Described is the “Kona Storm” when prevailing winds pushing into the windward side of the island mountain areas reverse to the leeward side. The low latitude storm in-place for several days entrained deep tropical moisture and when rinsed out in the form of heavy thunderstorms over Hawaii released latent heat to amplify the upstream high pressure ridge surging into the West U.S. this week (Fig. 2). The upper ridge delivers record heat to the West/Southwest U.S. for mid-March. During the past couple days, to compensate for the upper ridge off the West Coast, the Canadian polar vortex similarly amplified extending into the southern latitudes to easily entrain subtropical moisture causing the U.S. severe weather outbreak of March 15-16. On Sunday, NOAA/SPC issued 729 severe weather reports followed by (still counting) 471 reports yesterday (Fig. 3-4). The amplified upper ridge takes over the precipitation pattern during the next 1-2 weeks causing widespread dryness while the Pineapple Express pattern bringing heavy precipitation to Southwest Canada gradually eases (Fig. 5-6) Note the wet weather is pushed off the East Coast and is stationary springing westward to Mexico and the Southern States in the week 3-4 outlook (Fig. 7). The U.S. gas population weight HDD forecast indicates the influence of the warming ridge next week but colder weather in the East returns national heating demand to near normal for the week of March 27-April 2 (Fig. 8).
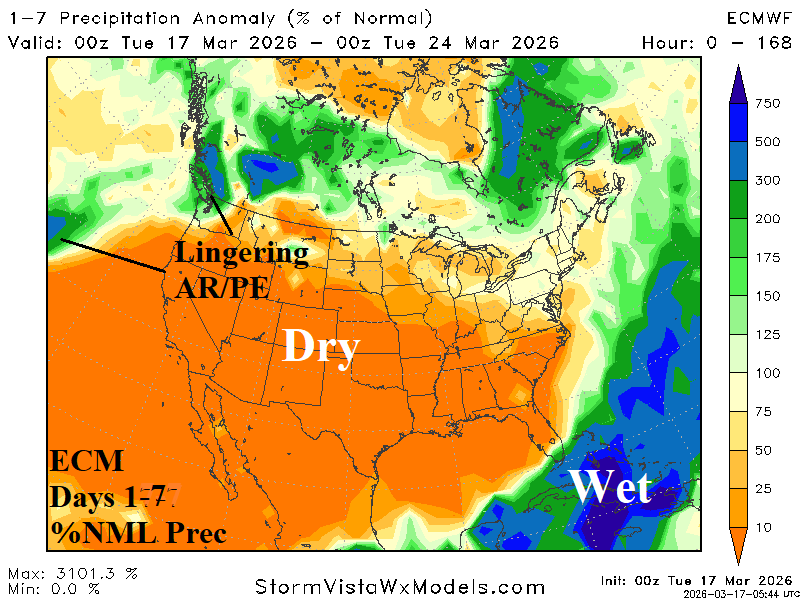
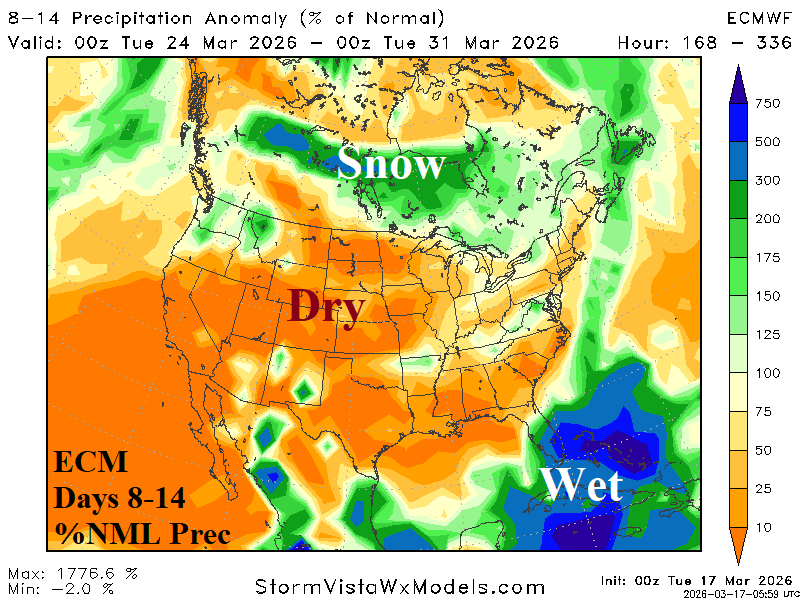
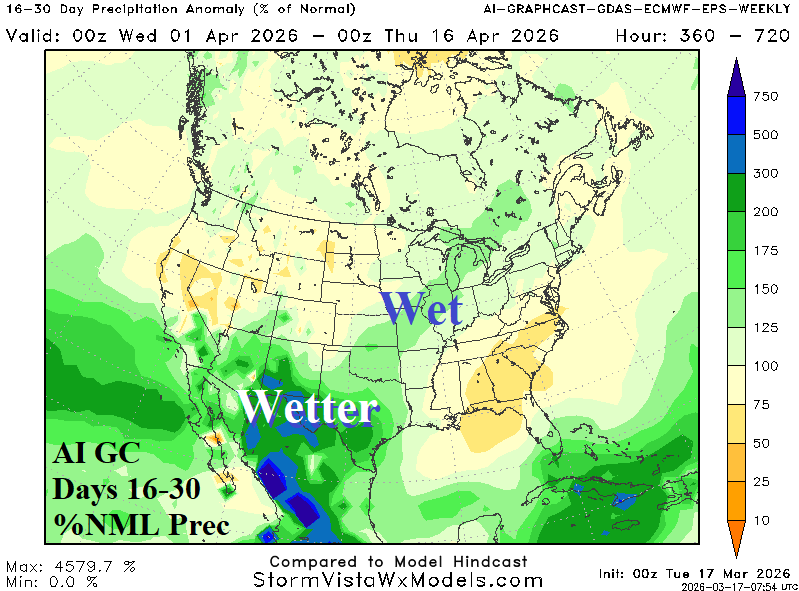
Fig. 5-7: The ECM 14-day percent of normal precipitation forecast and Graph Cast week 3-4 outlook.
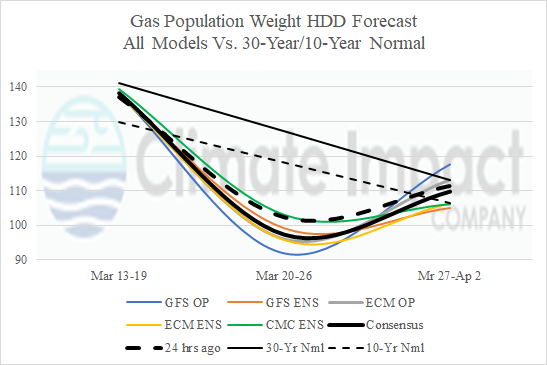
Fig. 8: The U.S. gas population weight HDD forecast utilizing all operational models, their consensus, and comparison with 24 hours ago and 30/10-year normal.