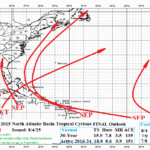
FINAL 2025 North Atlantic Tropical Cyclone Season Activity Forecast
08/04/2025, 8:16 am EDT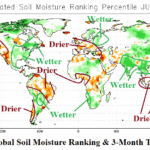
August 2025 Global Soil Moisture: Canadian Prairies wetter, monitoring short-term heat Central/East-central U.S. but drought development unlikely, West Europe drought.
08/10/2025, 12:04 pm EDT![]()
Climate Impact Company Daily Feature
Issued: Wednesday, August 6, 2025
Highlight: Record strong -PDO observed in July!
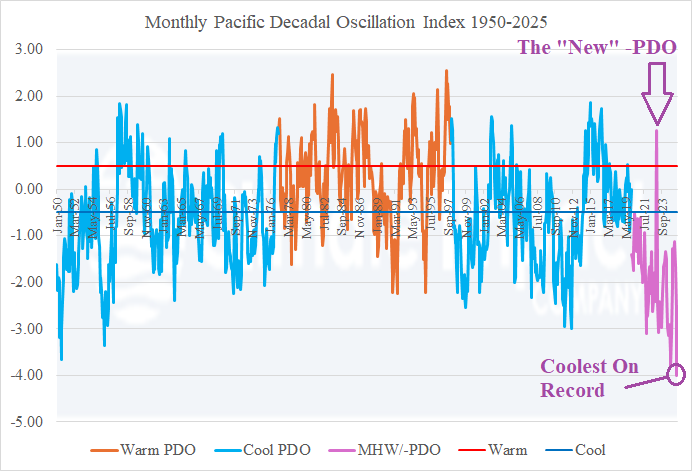
Fig. 1: The monthly PDO index for 1950-2025.
Discussion: July 2025 monthly Pacific decadal oscillation (PDO) index was the most negative (-4.00) in the 1950-2025 climatology (Fig. 1). The record -PDO was produced by the relationship between near to slightly cooler than normal sea surface temperature anomalies (SSTA) off the North America West Coast and the marine heatwave (MHW) excessive warm SSTA off the East Asia Coast and past the Dateline to 150W longitude (Fig. 2). The MHW-driven “new” -PDO regime has been with us the entire decade. The “new” -PDO regime follows the 2013-15 super MHW in the Northeast Pacific known as “the (warm) blob”. The “warm blob” helped to enhance the 2015-16 El Nino episode. Following that event, the anomalous warmth across the North Pacific shifted westward and has intensified in this decade reaching maximum strength during last month.
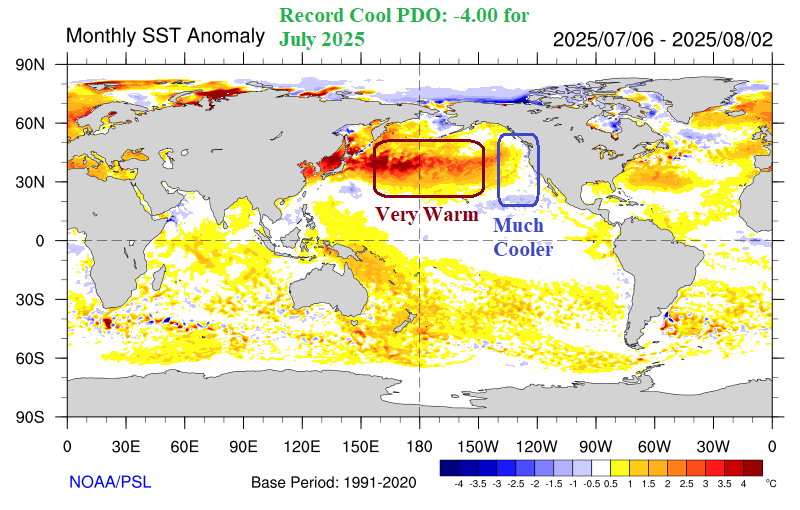
Fig. 2: The global SSTA analysis valid July 6 to August 2, 2025.

