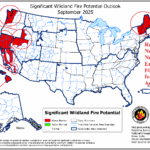
NOAA September Wildland Fires: Rare New England Risk, Widespread California Risk, and All Hawaii Risk
09/03/2025, 1:28 pm EDT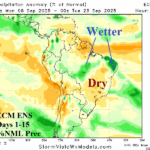
Extended-range Brazil Wet Weather Risk Easing Back
09/08/2025, 5:48 am EDT
Climate Impact Company AG Hot Spot
Issued: Thursday September 4, 2025
Highlight: South America update.
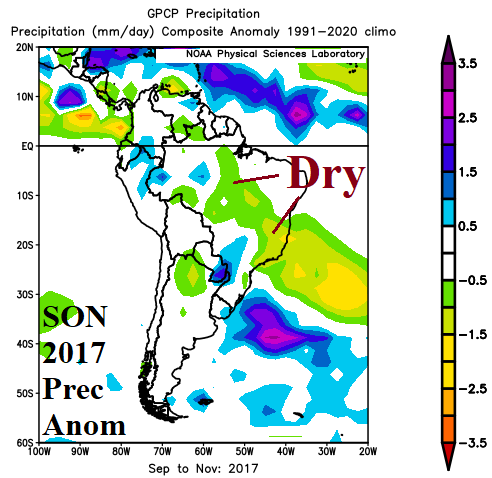
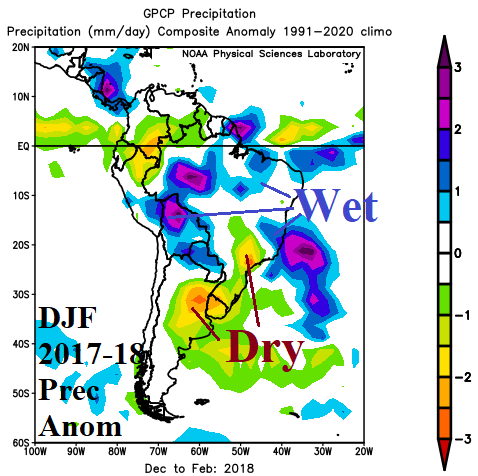
Fig. 1-2: SEP/OCT/NOV 2017 and DEC/JAN/FEB 2017-18 precipitation anomalies across South America.
Discussion: A weak La Nina is expected for Q4/2025 possibly lasting through Q1/2026 before ending. The best recent analog is 2017. In 2016, an El Nino ended and shifted to weak La Nina late that year followed by neutral ENSO in 2017 which was followed by the return of weak La Nina later in 2017. The 2024-25 Nino34 SSTA (ONI version) closely matches that regime During SEP/OCT/NOV 2017, the rainfall anomalies across South America favored dryness in Brazil (Fig. 1). The wetter regime across Brazil favored by La Nina was delayed until meteorological summer 2017-18 (Fig. 2) when dryness emerged in Argentina to Southeast Brazil.
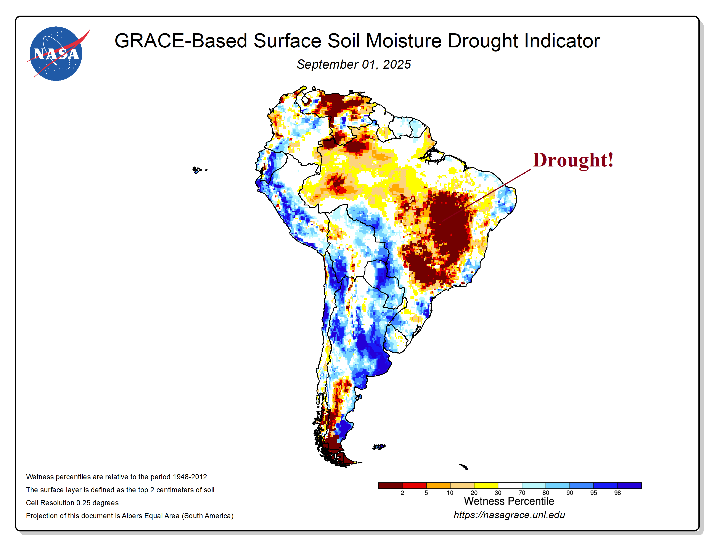

Fig. 3-4: GRACE-based soil moisture anomalies across South America and the 30-day percent normal rainfall observations.
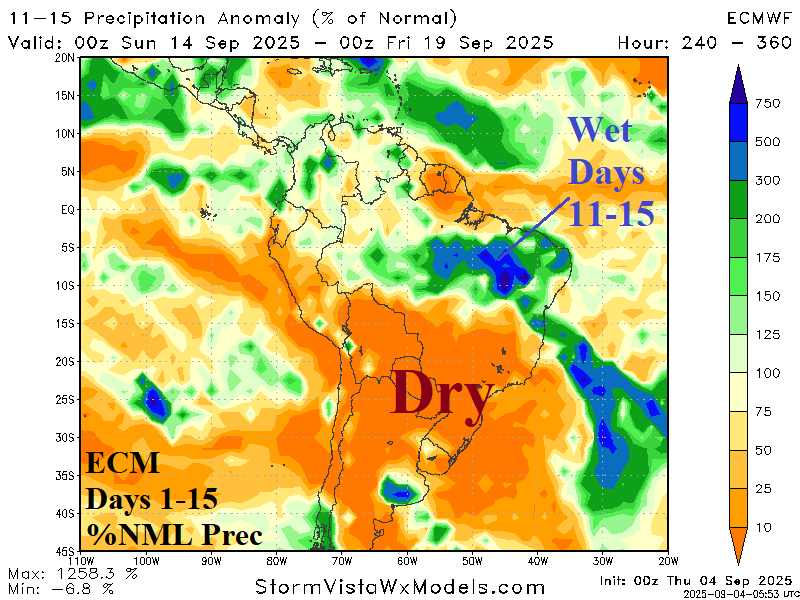
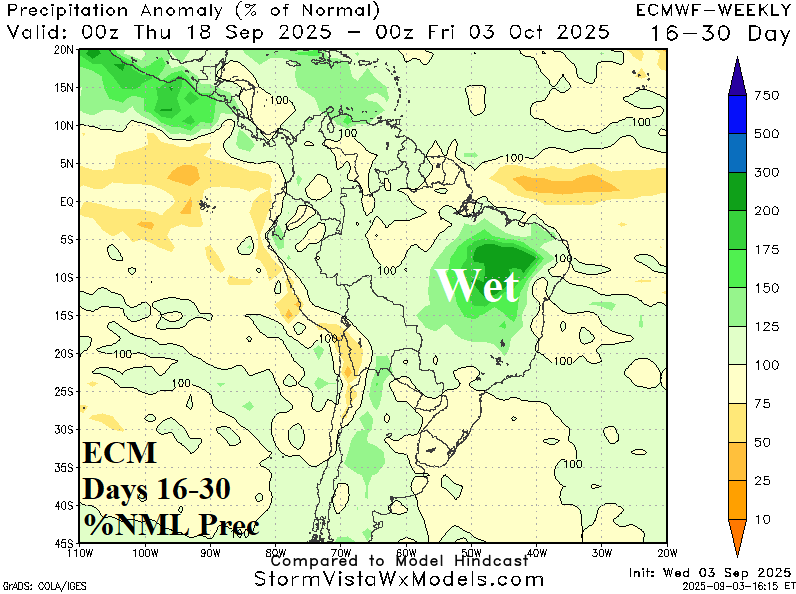
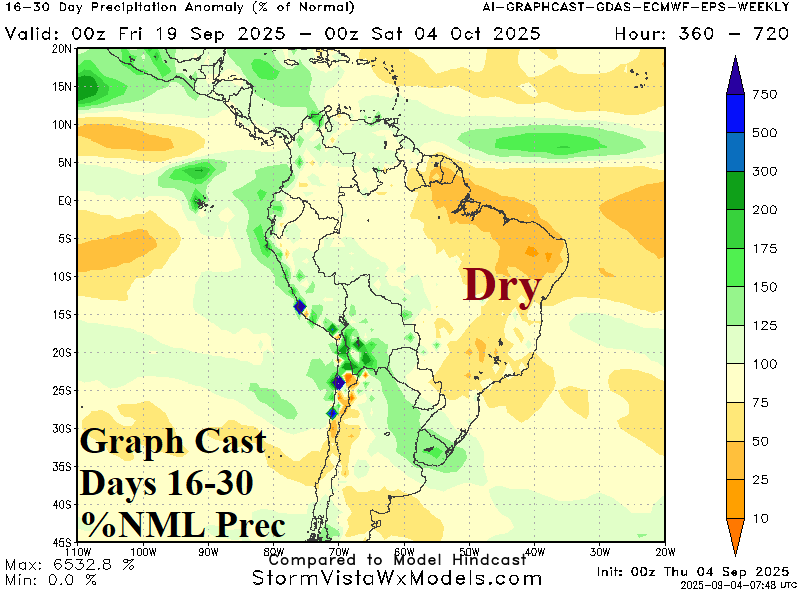
Fig. 5-7: The ECM 15-day percent of normal rainfall forecast develops rain in Brazil during the 11-15-day period carried forward into the 16-30-day forecast by ECM although AI Graph Cast doubts the wet weather.
Currently, the Brazil drought is intense (Fig. 3) and enhanced by lack of rainfall during the past 30 days (Fig. 4). The 10-day outlook remains dry across Brazil. However, in the 15-day rainfall forecast for South America, an area of rain appears in the northern Brazil drought area during the 11-15-day period (Fig. 5). The ECM expands the wet weather risk in Brazil during the 16-30-day forecast (Fig. 6) while machine learning models prefer persistent dryness (Fig. 7). The wetter trend offered by ECM is strengthening. Previously doubted wet weather for Brazil in the week 3-4 outlook is gaining confidence.