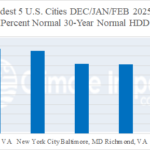
Coldest (Norfolk, VA) and Warmest (Phoenix, AZ) HDD Observations for U.S. Meteorological Winter 2025-26
03/03/2026, 3:00 pm EST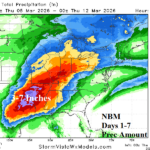
U.S. Severe Storms/Flooding Rainfall
03/05/2026, 5:39 am EST
Climate Impact Company Early AG Market ALERT
Issued: Wednesday March 4, 2026
Highlight: Wet Mid-south/Midwest U.S. pattern ahead; Wetter South America.
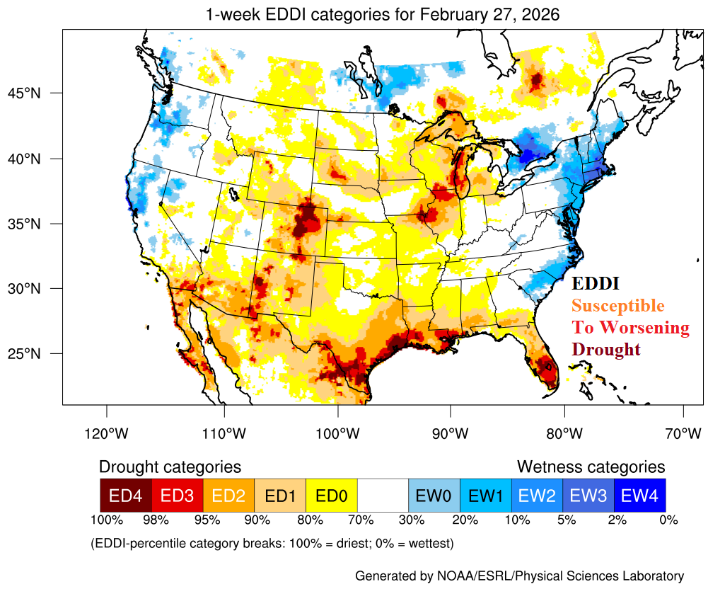
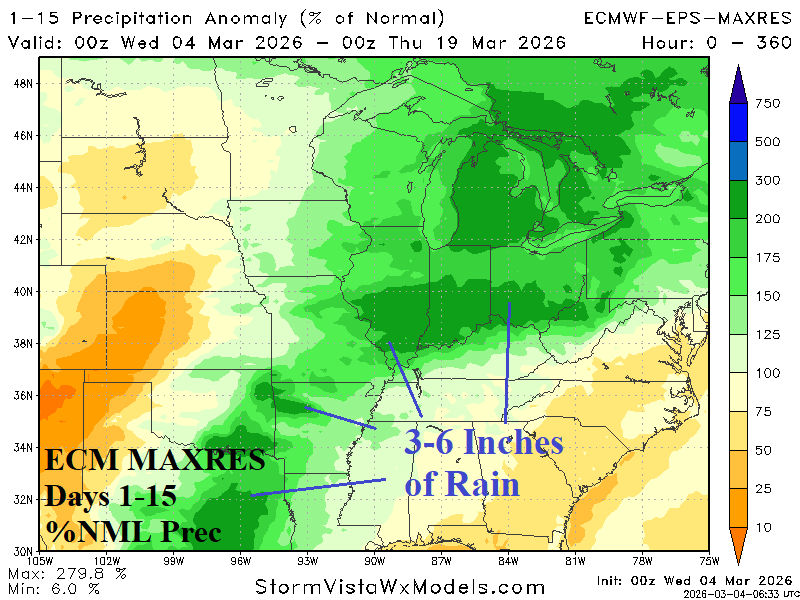
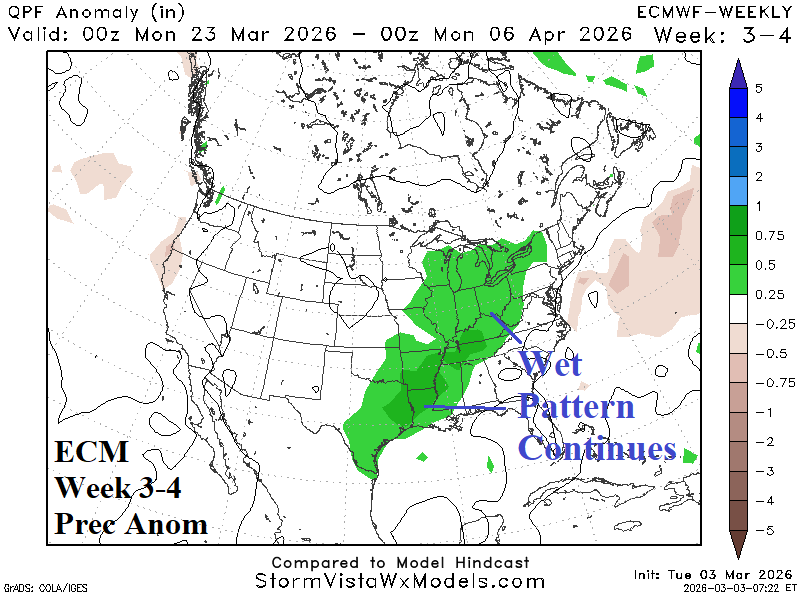
Fig. 1-3: The U.S. weekly evaporative drought demand index valid for late February, ECM MAXRES 15-day percent normal rainfall forecast, and ECM week 3-4 ahead precipitation anomaly outlook.
Discussion: The U.S. weekly evaporative drought demand index (EDDI) valid for late February indicates parts of the U.S. most susceptible to drought or flash drought as the warm season arrives is the Gulf States, parts of the Southwest U.S., and central U.S. Corn Belt (Fig. 1). If areas listed shifted into a dry climate as the warm season arrives, rapid drought development/intensification would generate in these zones. However, the U.S. precipitation pattern is forecast to change through the next 30 days featuring above to much above normal precipitation in Texas to the Ohio Valley in the latest 15-day outlook (Fig. 2) likely to continue in the week 3-4 period (Fig. 3).
Meteorological summer 2025-26 averaged drier than normal for much of South America (Fig. 4). Notable exceptions were Northern Argentina and Northeast Brazil where periods of wet weather were observed. The 30-day percent of normal rainfall analysis (Fig. 5) reveals emerging recent heavy rains in Northeast/East Brazil (while Argentina shifts drier). Departing meteorological summer South America soil moisture conditions reveal moderate-to-strong dry/drought conditions in parts of North-central to South-central Argentina and South-central to North-central Brazil (Fig. 6). Forecast models have consistently shown a wet bias, especially across Brazil, during the summer months. However, of late, the 15-day rainfall forecasts across South America are trending wetter for both Brazil and Argentina (Fig. 7). Marginally dry bias exists only in Southeast Brazil to coastal Northeast Argentina.
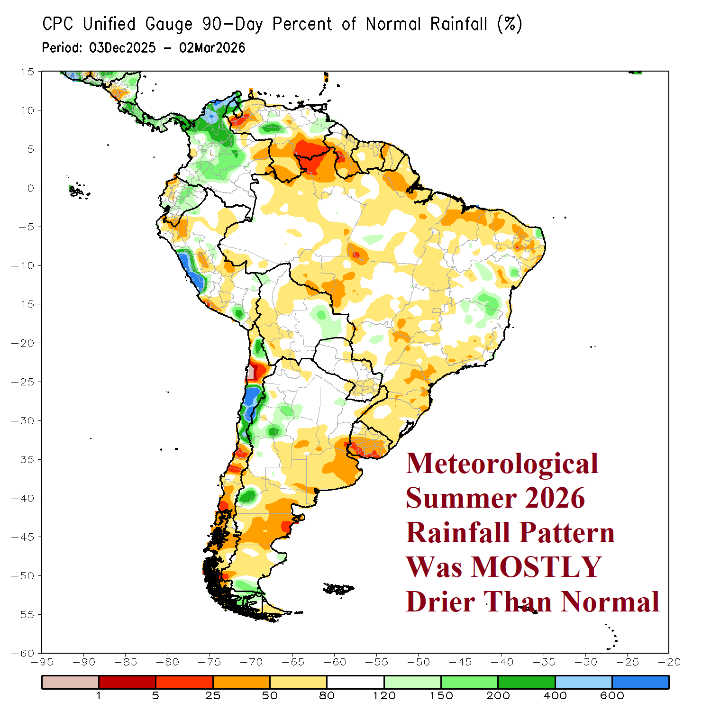
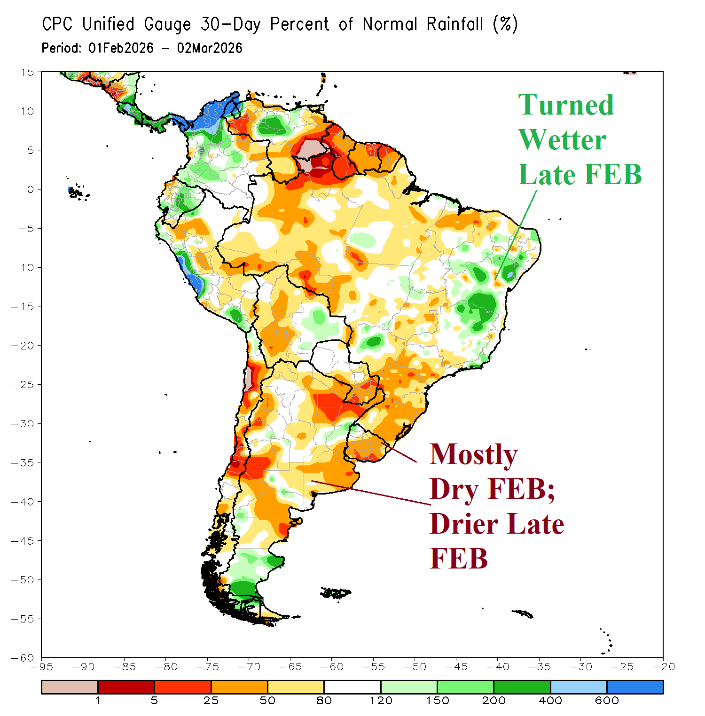
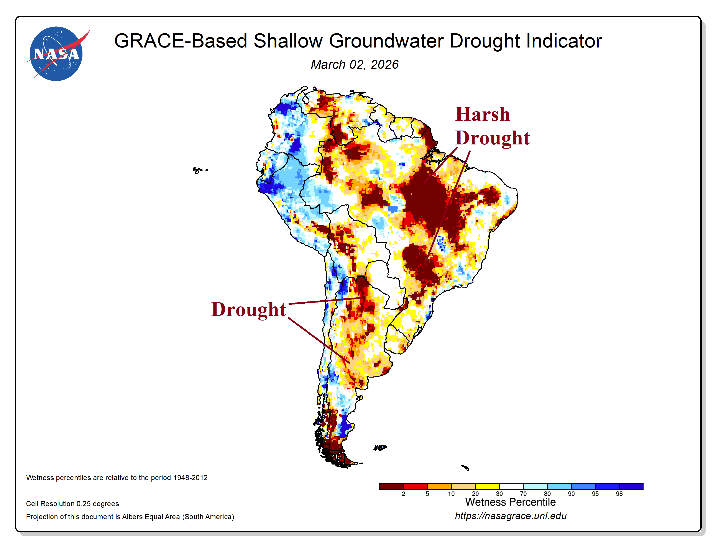
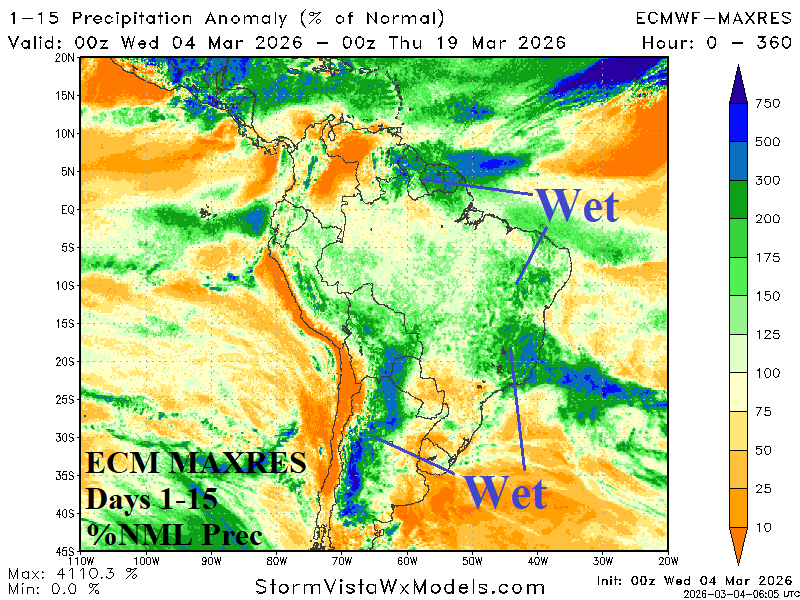
Fig. 4-7: The 90-day and 30-day percent normal rainfall observations across South America (upper) and GRACE-based shallow groundwater anomalies across South America, and the ECM MAXRES 15-day percent normal rainfall outlook.