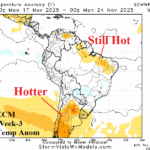
Trending Drier/Hotter Argentina in November
10/31/2025, 10:06 am EDT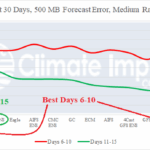
Model Skill Scores Past 30 Days Forecasting U.S. Medium-range Weather Pattern
11/04/2025, 8:33 am EST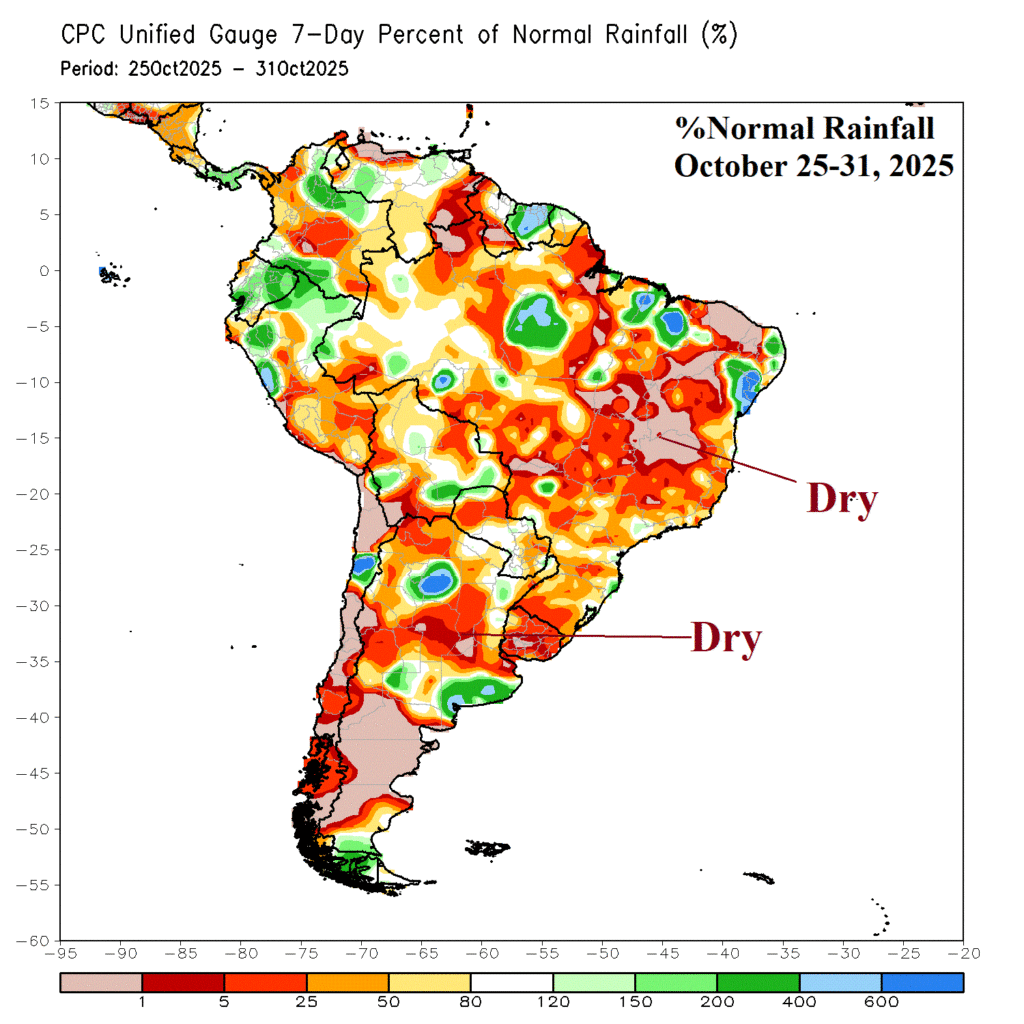

Climate Impact Company AG Hot Spot
Issued: Monday November 3, 2025
Highlight: Shifting climate pattern affects Brazil rainfall.
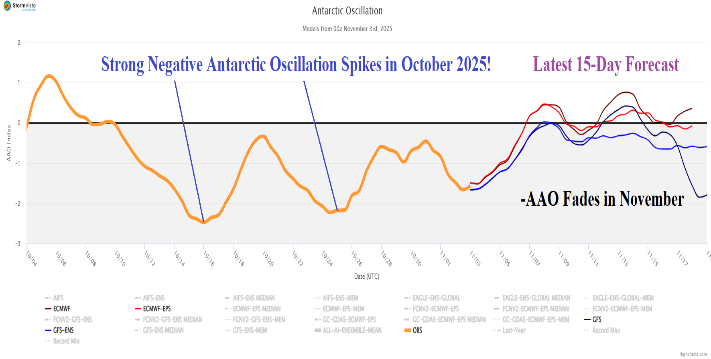

Fig. 1-2: The unusually strong negative phase Antarctic oscillation during OCT-25 fades during NOV-25 and the rainfall anomalies across South America during OCT-25.
Discussion: During October, an unusually strong Antarctic oscillation (-AAO) was present (Fig. 1). The climate pattern helped force a drier than normal October climate across Central and East Brazil (Fig. 2), unusual for an evolving La Nina. The dryness which continued during the last week of October (Fig. 3). The MJO is forecast to shift eastward across the tropical Pacific during the next 2 weeks (Fig. 4) while the -AAO pattern fades. Tropical influences on South America climate, particularly Brazil, should increase in November. The 7-day forecast is wet in Brazil due to influences of the transition from negative to neutral AAO (Fig. 5). In the 8-14-day outlook, wet weather in South America is strongly linked to the tropics (Fig. 6).


Fig. 3-4: The percent of normal rainfall across South America during October 25-31, 2025 and the climatology of vertical motion (blue)/wet climate bias associated with an expected shift of the Madden Julian oscillation from phase_5 to phase_7 over the next 2 weeks.


Fig. 5-6: The ECM ENS 1-7-day and 8-14-day rainfall anomalies forecast across South America.