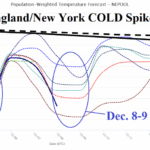
The Cold Spike for PJM and NEPOOL Starting Meteorological Winter 2025-26
12/01/2025, 5:56 am EST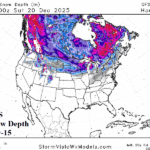
Snow Cover Increase Western Canada into Northwest U.S. Increase Next 2 Weeks
12/05/2025, 6:18 am EST
Climate Impact Company Weekly ENSO Climate Diagnostics
Issued: Tuesday December 2, 2025
Highlight: Is La Nina starting to end?
Discussion: Last week, the NINO SSTA regions warmed including the Nino 4 (near the Dateline) and Nino12 (northwest coast of South America) where sea surface temperature anomalies (SSTA) shifted to neutral phase (Fig. 1). The Nino34 SSTA barely remains within the La Nina threshold. The warming is likely due to weakening trade winds slowing the upwelling of cool water process. Weaker trade winds were caused by surface pressure shifting across the tropical Pacific Ocean as identified by the negative phase southern oscillation index (Fig. 2). Subsurface waters are marginally cool in November implying very limited fuel to maintain La Nina (Fig. 3). The warming observed last week may be a sign that La Nina was weak and a shift to neutral phase ahead as implied by the latest NCEP CFS V2 Nino34 SSTA forecast (Fig. 4).
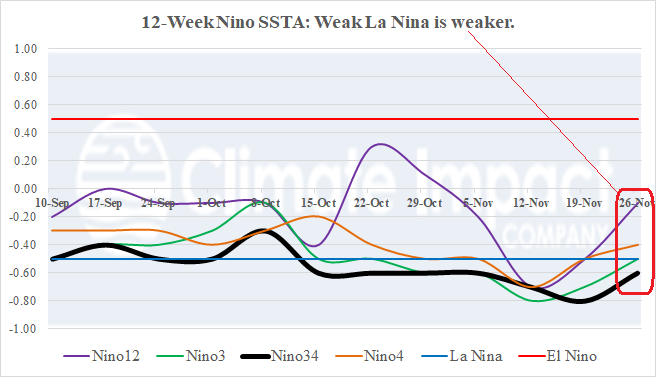
Fig. 1: The weekly Nino SSTA observations for the past 12 weeks.
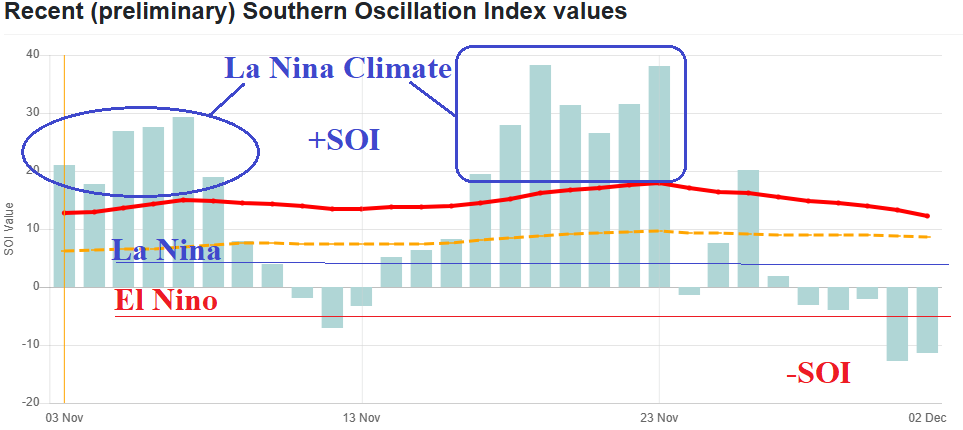
Fig. 2: The daily southern oscillation index with 30-day and 90-day running average.
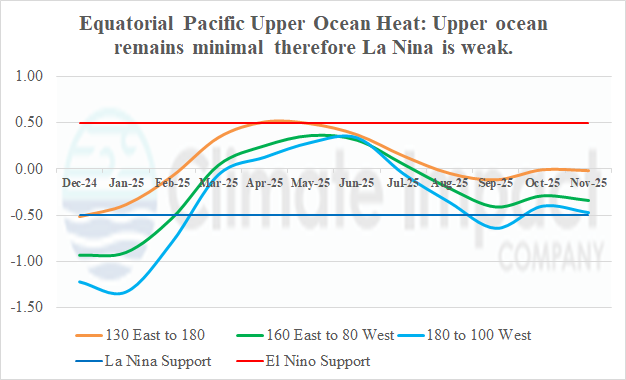
Fig. 3: The monthly upper ocean heat anomalies across the equatorial Pacific Ocean for the past 12 months.
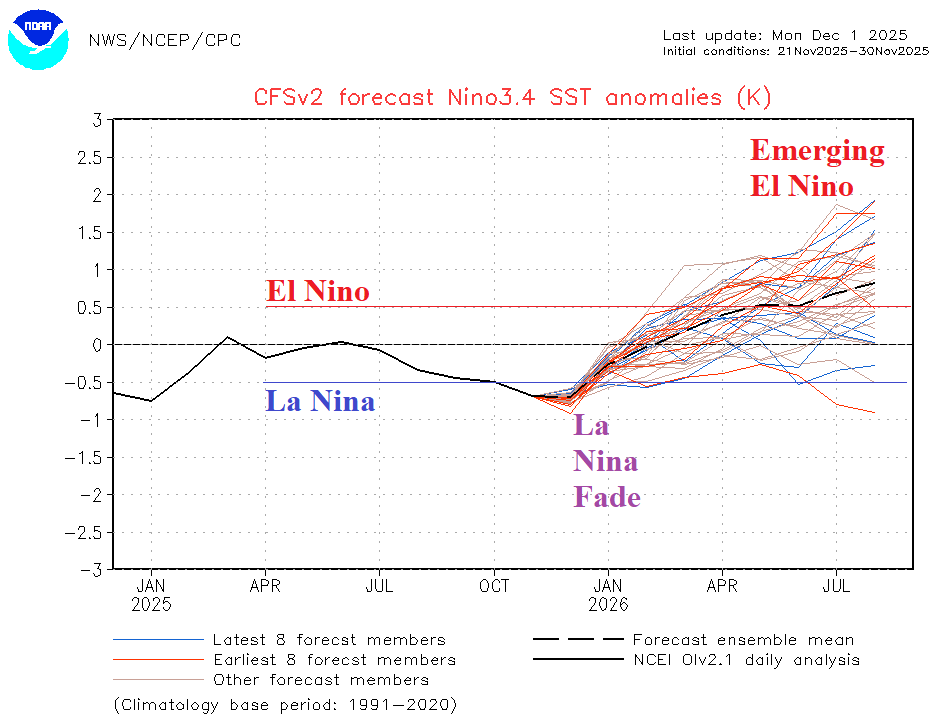
Fig. 4: The NCEP CFS V2 Nino34 SSTA forecast through mid-2026.