Explaining Why “Weeklies” Performed Temperature Forecasts Poorly During Summer 2025
08/19/2025, 12:26 pm EDT
Why Is Gulf of Mexico and Caribbean Sea Lacking TC’s So Far?
08/27/2025, 5:29 am EDT
Climate Impact Company Tropical Feature
Issued: Sunday August 24, 2025
Highlight: Other than Erin, 2025 is quiet so far. However, SEP/OCT/NOV are typically active 2016-24 and approaching La Nina should maintain that pattern despite cooler 2025 North Atlantic SSTA.
Discussion: Currently, operational models doubt risk of a 2nd hurricane prior to September 1st. Yet, operational seasonal forecasts maintain near normal hurricane activity in the 2025 seasonal forecast
Last year, although 4 hurricanes (1 major hurricane [Beryl]) were observed prior to September 1, the bulk of the season’s activity (13 of 18 storms) followed with 3 events (including Major Hurricane Rafael) occurring in November. Although early season activity was plentiful in 2023, another 9 events emerged after September 1. Tropical cyclone activity for 2022 produced 13 of 17 seasonal events after September 1 (including 8 hurricanes). In 2021, 9 of 20 events took place after September 1. A record 30 events were observed in 2020 with 16 events including 6 major hurricanes occurring after September 1. On average, in this decade, 12 tropical storms have generated after September 1 with 6 reaching hurricane strength and nearly 3 intensifying to major hurricanes (Table 1).
During the 2016-24 active period for the North Atlantic basin, after September 1 has averaged 11 tropical storms with nearly 7 hurricanes and 3 major hurricanes (Fig. 1).
Cited as the primary contributor to the active (2016-24) tropical cyclone period in the North Atlantic basin are warm September basin-wide SSTA regimes as identified by the Atlantic multi-decadal oscillation (AMO) and main development region (MDR) for hurricanes in-between the Caribbean Sea and tropical West Africa demonstrated by the tropical North Atlantic (TNA) index. Note the general steady warming from 2016 to 2022 followed by record warm spikes of 2023-24 (Fig. 2).
This year, especially after Erin, North Atlantic waters have cooled substantially as of late August. The global SSTA forecast by ECMWF (Fig. 3) for September indicates the TNA index is near the 30-year normal and possibly the coolest of the 2016-24 active period. The AMO index is projected coolest since 2018 (+0.5).
During the 2016-24 active period, 2018 stands out as the least warm North Atlantic basin and could be a reasonable analog for 2025. In 2018, 10 tropical storms occurred after September 1st with 5 hurricanes and only 1 intense hurricane. However, in 2018 a weak El Nino was forming while in 2025 signs of weak La Nina ahead are present.
Summary: Other than Erin, the 2025 season has been quiet so far. However, during the 2016-24 active period, after September 1 is typically quite active featuring 7 hurricanes and 3 intense hurricanes. As September 2025 approaches, the North Atlantic basin is warmer than normal but arguably the least warm since 2015. Previously, 2018 produced least warm North Atlantic basin SSTA during September when peak tropical cyclone activity occurs. However, in 2018 a weak La Nina was forming and in 2025, signs of a weak La Nina are ahead. Therefore, despite the less warm North Atlantic, the La Nina tendency should produce a favorable atmospheric environment for tropical cyclone development during SEP/OCT/NOV 2025.
| Tropical Storms | Hurricanes | Intense Hurricanes | |
| 2024 | 13 | 8 | 4 |
| 2023 | 9 | 4 | 1 |
| 2022 | 13 | 8 | 2 |
| 2021 | 9 | 2 | 1 |
| 2020 | 16 | 10 | 6 |
| Average | 12.0 | 6.4 | 2.8 |
Table 1: The North Atlantic basin tropical cyclone activity observed after September 1st this decade.

Fig. 1: Tropical cyclone activity after September 1st across the North Atlantic basin.

Fig. 2: The September Atlantic multi-decadal oscillation and tropical North Atlantic index for the active (2016-24) tropical cyclone period and the daily AMO and TNA for August 23, 2025.
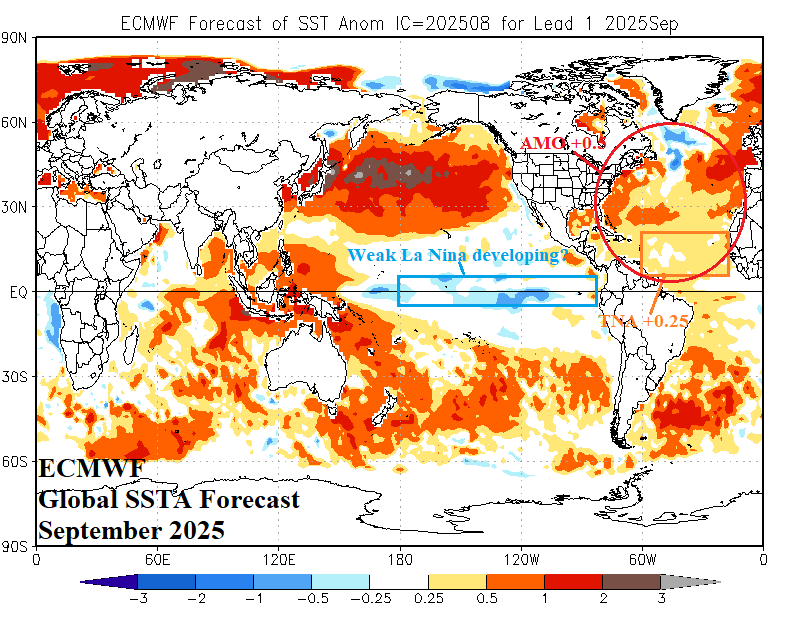
Fig. 3: The ECMWF global SSTA forecast for September 2025 projects marginally warm AMO (+0.50) and TNA (+0.25). Note the trend toward weak La Nina in the equatorial East Pacific.