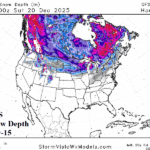
Snow Cover Increase Western Canada into Northwest U.S. Increase Next 2 Weeks
12/05/2025, 6:18 am EST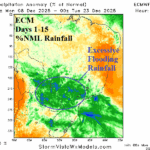
Excessive Rainfall Forecast by ECM Central/East-central South America.
12/08/2025, 4:30 am EST
![]()
Climate Impact Company U.S. Sunday Report
Issued: Sunday, December 7, 2025
Highlight: The frigid start to December, more cold on the way, decelerating cold last third of month into early January. Models/teleconnections review.

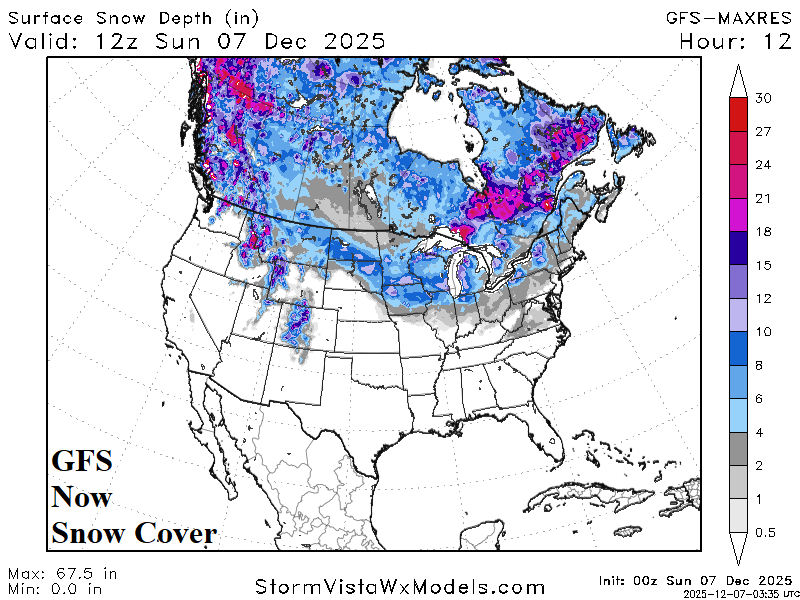
Fig. 1-2: The U.S. temperature anomaly analysis for December 2025 so far and the GFS-generated current snow dept across the U.S.
Discussion: The eastern 2/3 of the U.S. have been historically cold to start December (Fig. 1). The coldest anomalies are centered on Illinois. Snow cover is a significant catalyst to the cold pattern covering 40% of the U.S. and reaching farther south than normal in the Midwest to the Mid-Atlantic States (Fig. 2). The snow depth forecasts for late this week and later next week maintain the southern arc of above normal snow cover across the East-central U.S. (Fig. 3-4). Consequently, the 15-day GFS U.S. temperature anomaly forecast stays cold across the North and into the East (Fig. 5). Moderation, or possibly a warmer pattern change, is indicated by some operational models notably ECM in the 11-15-day period. Climate signals forecasts identify provide clues as to where the weather pattern is heading after mid-December. The West Pacific oscillation (WPO) and Pacific North America (PNA) index is negative after mid-December supporting a shift and expansion of the cold pattern over western North America (Fig. 6). Negative East Pacific oscillation (-EPO) spikes in one week as another “polar vortex” cold outbreak strikes the U.S. The North Atlantic oscillation (NAO) aggressively shifts to positive phase during the medium range supporting an eastern North America warm-up and validating the -WPO/-PNA colder support in the West. The question is whether -NAO warmth can eat away at the snow cover validating very warm 11-15-day forecasts by ECM. AI forecasts maintain the cold in the extended range while one AI model, AIFS, matches the very warm ECM pattern change. Bottom line? More cold weather Central and East ahead! Included, another cold “polar vortex” strike for next weekend and early next week. Support for a warmer pattern change is indicated for days 11-15. However, snow cover limits +NAO warming influence, and the Midwest to Northeast States are likely to stay cold. The U.S. 6-week HDD forecast vividly relays the character of U.S. heating demand ahead (Fig. 7). 10-day forecasts are cold, revised colder for next week, with decelerating cold for Christmas week, possibly too warm as indicated by models. However, the week 4-6 forecast supports decelerating cold and milder than (10-year) normal for early January.

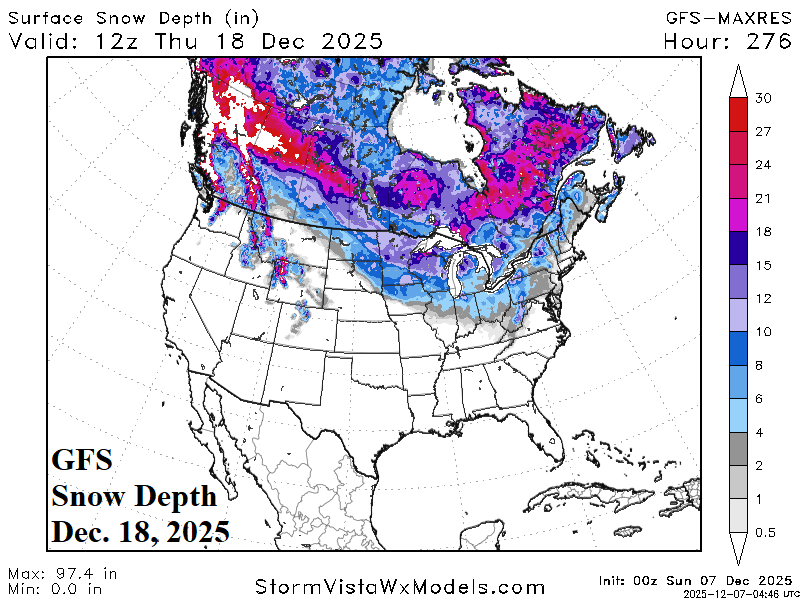
Fig. 3-4: The GFS snow depth forecast for next Saturday and Thursday of the following week.
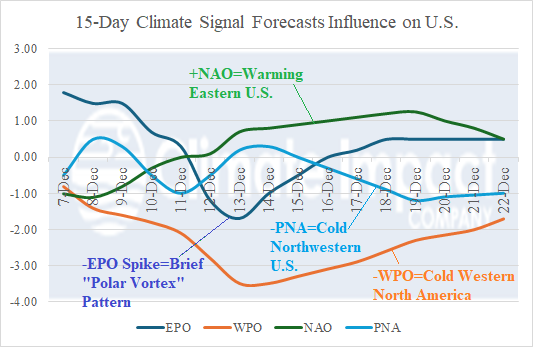
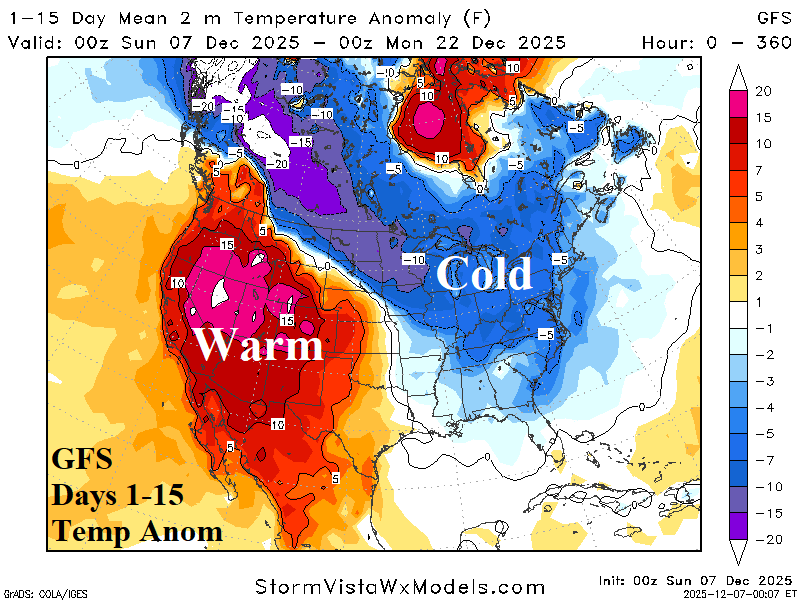
Fig. 5-6: The GFS 15-day U.S. temperature forecast, and 15-day climate signals projections based on a consensus of all models.

Fig. 7: The U.S. gas population weight HDD forecast utilizing all models through Dec. 25th and CIC HDD estimates for week 4-6 combining CFS/ECM and 3 AI models.

![]()
Climate Impact Company U.S. Sunday Report
Issued: Sunday, December 7, 2025
Highlight: The frigid start to December, more cold on the way, decelerating cold last third of month into early January. Models/teleconnections review.
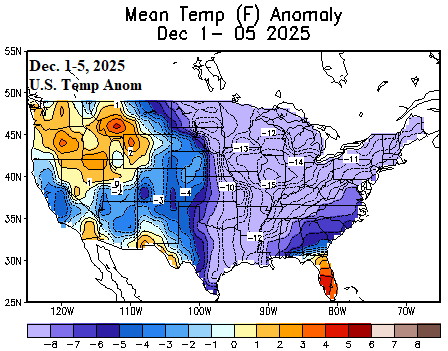

Fig. 1-2: The U.S. temperature anomaly analysis for December 2025 so far and the GFS-generated current snow dept across the U.S.
Discussion: The eastern 2/3 of the U.S. have been historically cold to start December (Fig. 1). The coldest anomalies are centered on Illinois. Snow cover is a significant catalyst to the cold pattern covering 40% of the U.S. and reaching farther south than normal in the Midwest to the Mid-Atlantic States (Fig. 2). The snow depth forecasts for late this week and later next week maintain the southern arc of above normal snow cover across the East-central U.S. (Fig. 3-4). Consequently, the 15-day GFS U.S. temperature anomaly forecast stays cold across the North and into the East (Fig. 5). Moderation, or possibly a warmer pattern change, is indicated by some operational models notably ECM in the 11-15-day period. Climate signals forecasts identify provide clues as to where the weather pattern is heading after mid-December. The West Pacific oscillation (WPO) and Pacific North America (PNA) index is negative after mid-December supporting a shift and expansion of the cold pattern over western North America (Fig. 6). Negative East Pacific oscillation (-EPO) spikes in one week as another “polar vortex” cold outbreak strikes the U.S. The North Atlantic oscillation (NAO) aggressively shifts to positive phase during the medium range supporting an eastern North America warm-up and validating the -WPO/-PNA colder support in the West. The question is whether -NAO warmth can eat away at the snow cover validating very warm 11-15-day forecasts by ECM. AI forecasts maintain the cold in the extended range while one AI model, AIFS, matches the very warm ECM pattern change. Bottom line? More cold weather Central and East ahead! Included, another cold “polar vortex” strike for next weekend and early next week. Support for a warmer pattern change is indicated for days 11-15. However, snow cover limits +NAO warming influence, and the Midwest to Northeast States are likely to stay cold. The U.S. 6-week HDD forecast vividly relays the character of U.S. heating demand ahead (Fig. 7). 10-day forecasts are cold, revised colder for next week, with decelerating cold for Christmas week, possibly too warm as indicated by models. However, the week 4-6 forecast supports decelerating cold and milder than (10-year) normal for early January.
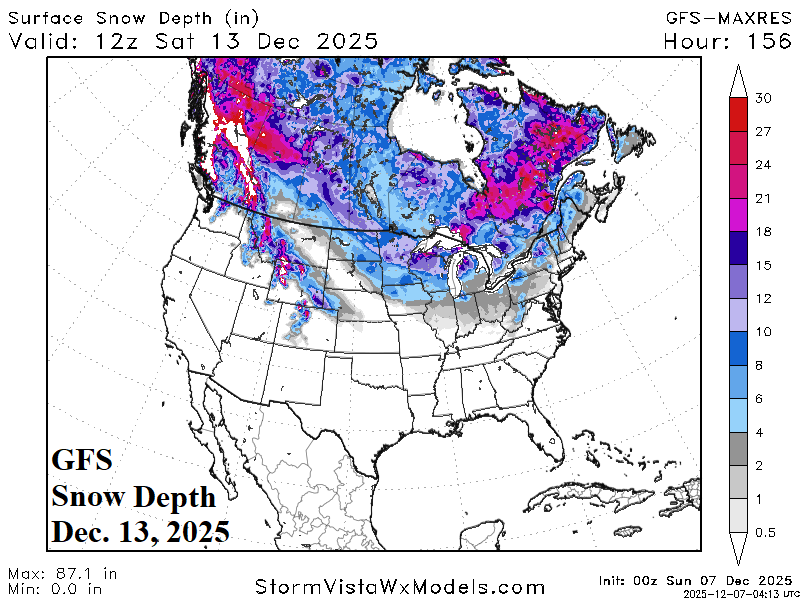

Fig. 3-4: The GFS snow depth forecast for next Saturday and Thursday of the following week.


Fig. 5-6: The GFS 15-day U.S. temperature forecast, and 15-day climate signals projections based on a consensus of all models.

Fig. 7: The U.S. gas population weight HDD forecast utilizing all models through Dec. 25th and CIC HDD estimates for week 4-6 combining CFS/ECM and 3 AI models.