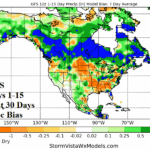
GFS and ECM Rainfall Forecast Bias across U.S. AG Belt
05/28/2025, 12:31 pm EDT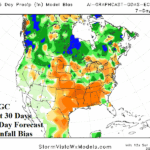
ECM ENS, AI Graph Cast, and U.S. AG Belt Rainfall
06/01/2025, 3:54 pm EDT

Climate Impact Company North Atlantic Basin 10-Day Monitor
Issued: Thursday May 29, 2025, 9:00AM EDT
Highlight: Upper ocean heat in tropical North Atlantic continues to lower.
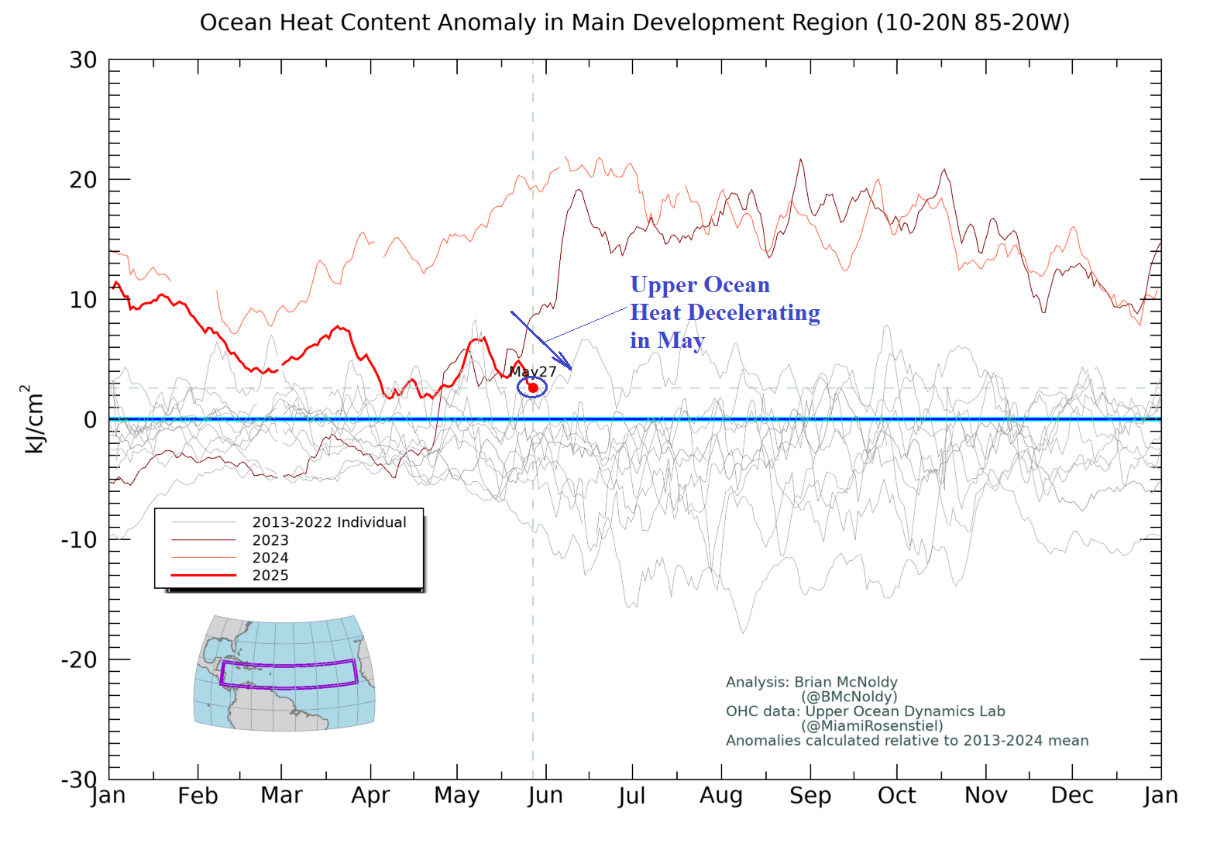
Fig. 1: The upper ocean heat observations across the tropical North Atlantic.
Discussion: Upper ocean heat across the tropical North Atlantic basin rivaled the warmest values on record established last year to start 2025. However, upper ocean heat is shifting less impressive as June approaches and is now below the record warmth of the past 2 years and within the upper limit of the 2013-22 climatology (Fig. 1). A notable decline is observed in May. In the tropical East Pacific, Tropical Depression 1 has formed as is forecast to become a tropical storm (Alvin) tomorrow as the storm turns northward but weakens over cooler water beneath upper shear this weekend (Fig. 2). Nevertheless, moisture from Alvin spreads across the Mexico Drought Area and into the Southwest U.S. this weekend and early next week (Fig. 3). Also note the gathering tropical rains south and southeast of Florida into early next week.
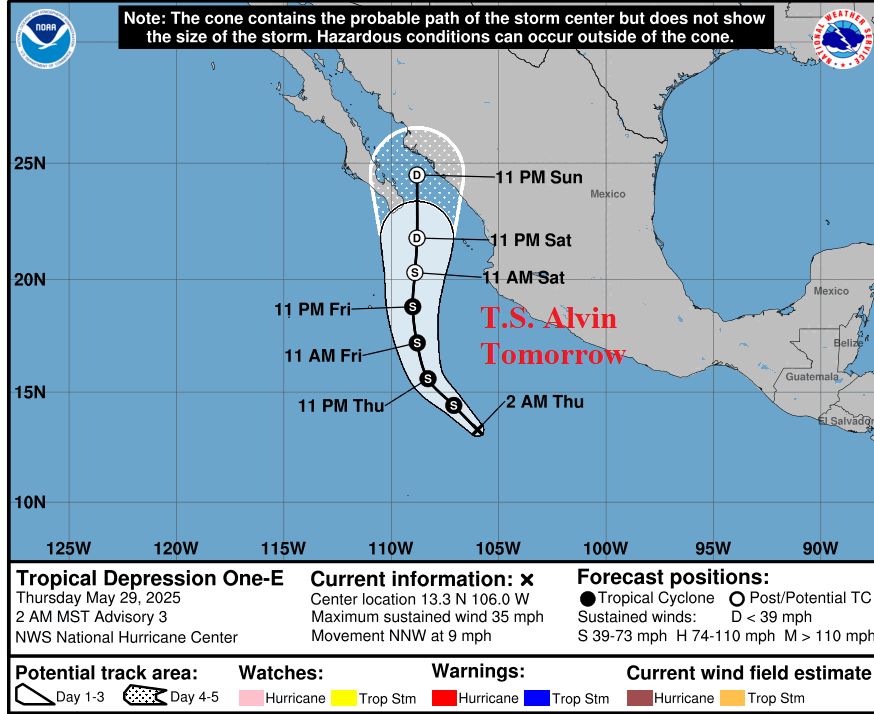
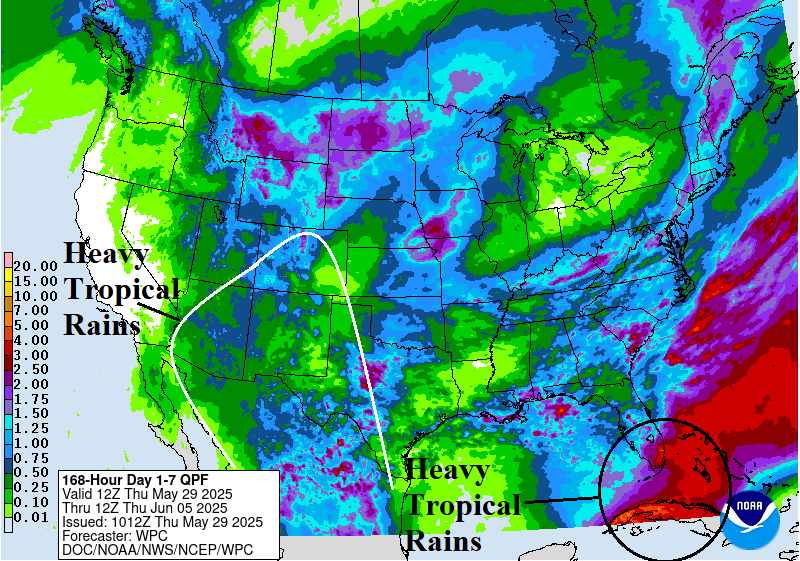
Fig. 2-3: NOAA/NHC 5-day forecast track for the East Pacific Tropical Depression 1 and the NOAA/WPC 7-day rainfall forecast.