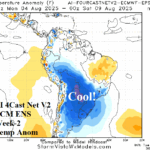
Testing Warm ECM Vs. Colder AI for Brazil Ahead
07/29/2025, 5:29 am EDT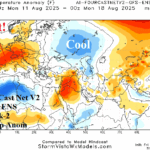
Western Europe Heatwave Ahead!
08/01/2025, 6:07 am EDT
Climate Impact Company Early U.S. Notes
Issued: Thursday July 31, 2025
Highlight: Dangerous flood risk for the Mid-Atlantic States today.

Fig. 1: NOAA/NWS weather watch, warning, and advisories.
Discussion: The heatwave slowly constricts to the Gulf States into late week (Fig. 1). In the Mid-Atlantic region, a Flood Watch is issued for excessive rainfall and severe storm threat for today (Fig. 2-3). In high population centers of Washington, Baltimore, and Philadelphia dangerous flash flooding is possible late today/tonight! An Air Quality Alert is posted for the Upper Midwest and Great Lakes region, increasing aerial coverage and intensity! Red Flag Warning’s are posted for the Great and Columbia Basin(s). The latest U.S. population weight CDD forecast indicates the week ending today is as hot as the August 8-14 forecast challenging for hottest week of summer (Fig. 4)!

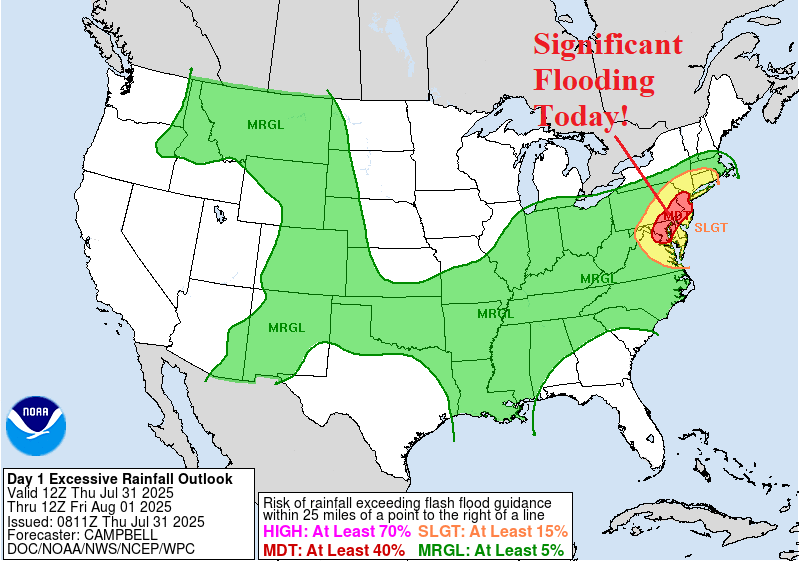
Fig. 2-3: NOAA/SPC severe weather outlook and NOAA/WPC excessive rain/flood risk projection for today.
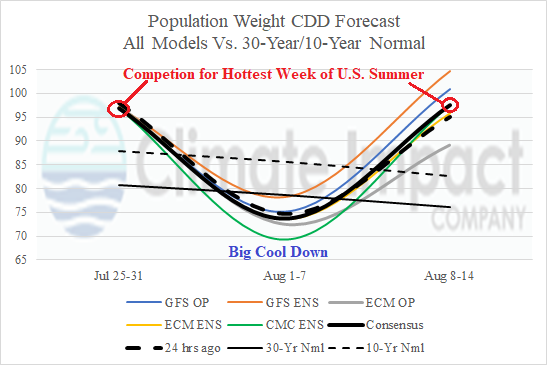
Fig. 4: The U.S. population weight CDD forecast utilizing all models through mid-August.