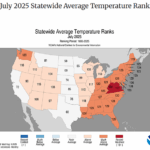
U.S. Climate Rankings for Each State in July
08/12/2025, 9:37 am EDT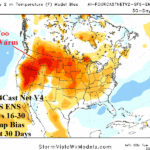
Explaining Why “Weeklies” Performed Temperature Forecasts Poorly During Summer 2025
08/19/2025, 12:26 pm EDT
U.S. Soil Moisture Observations/Forecast Report
Issued: Monday August 18, 2025
Highlight: Worsening West/Southwest U.S. drought; Adding New York/New England drought risk. Carolinas/parts of Midwest are susceptible to flooding.
Executive summary: The U.S. soil moisture observations and trend reveal ongoing and worsening West/Southwest U.S. drought and adding Northeast U.S. dryness which is (also) strengthening. The southern Canadian Prairies to the Midwest States and Carolinas are the wet zones. The outlook indicates above normal risk of fire danger and flash drought for the West and Northeast States. Wet soils in the Carolinas to Georgia implicate that region for extreme flood risk given an inland tracking tropical cyclone. The Northeast States require a significant rain event to worsen the drought trend. The NOAA Northwest U.S. high fire risk zone should extend farther south and east to cover much of the Intermountain region.


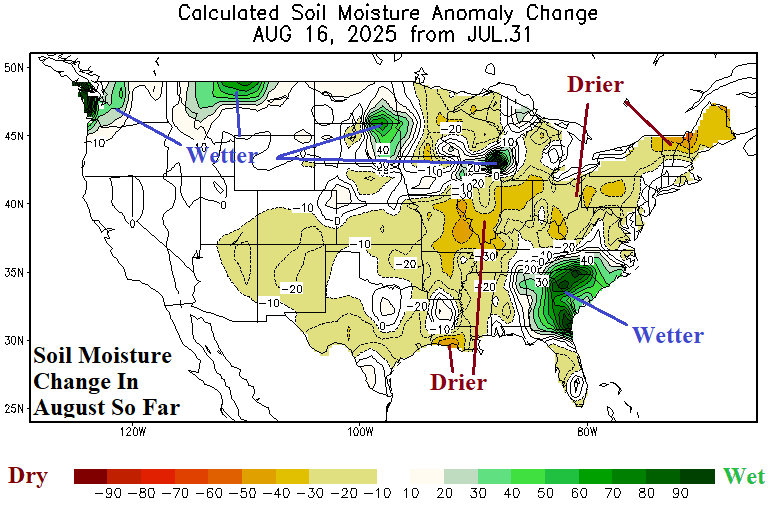
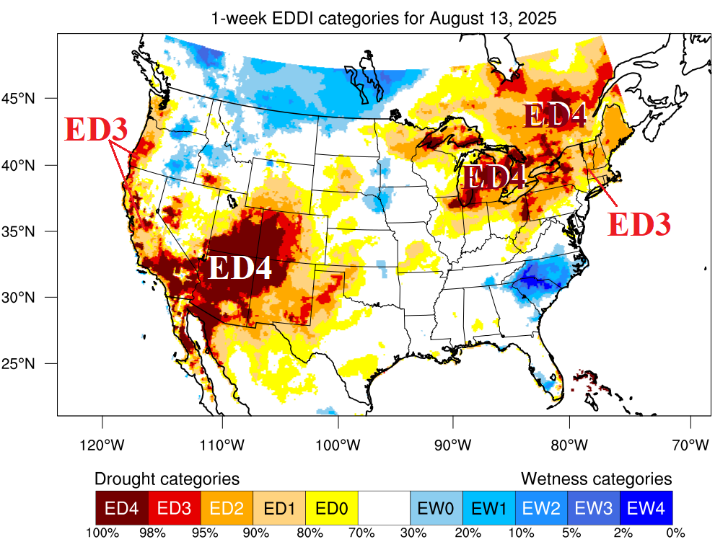
Fig. 1-4: U.S. percent of normal rainfall from the past 30 days, daily U.S. soil moisture ranking and August (so far) change plus the latest 1-week U.S. evaporative drought demand index analysis.
Discussion: Mid-to-late summer U.S. rainfall has featured mostly dry extremes centered on California, the Great Basin, and Southwest U.S. adding Texas and the Mid-south States plus the Northeast U.S. (Fig. 1). Wet weather has persisted across parts of the Northwest U.S. near the Canadian Border and into the southern Canadian Prairies to the Midwest States plus Georgia and the Carolinas. Consequently, harsh drought continues and worsens across much of the Interior West/Southwest States/California and is evolving in the Northeast (Fig. 2). During August, the U.S. soil moisture change is profoundly drier across the entire eastern half of the U.S. except parts of the Midwest U.S. and Carolinas (Fig. 3). The U.S. evaporative drought demand index (EDDI) indicates areas at high risk of rapidly spreading fires into the autumn season is centered on the 4 Corners Region to Southern California and continuing in Quebec/Ontario while spreading to the northern Ohio Valley to New England (Fig. 4). In these zones, worsening drought or flash drought risk is elevated. Areas susceptible to dangerous flooding extend across the Carolinas and are evolving in parts of the Midwest States.
The NOAA SPI6 probabilistic soil moisture forecast for November 2025 maintains and worsens West U.S. and New York/New England drought (Fig. 5). Weak dry soil conditions are indicated in the Mid-south U.S. The older NCEP/CAS model projects the West U.S. dryness, strengthens the East Coast wet condition centered on the Carolinas, and introduces a new drought area extending from Louisiana northward to the Missouri and Ohio Valley (Fig. 6). The Gulf Coast dryness is interesting given the active tropical cyclone season forecast still ahead.
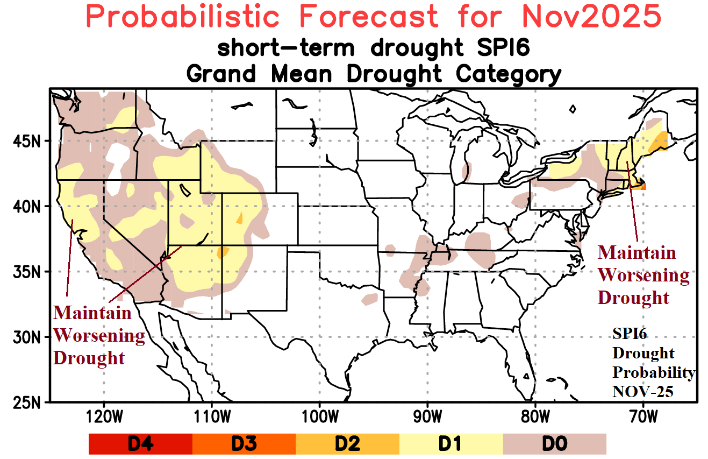
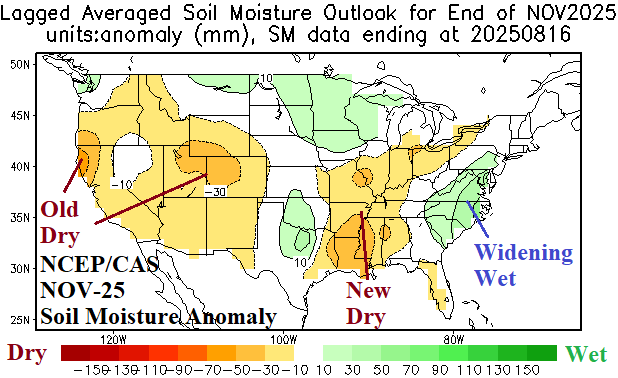
Fig. 5-6: The NOAA SPI6 (model) probabilistic soil moisture forecast for November 2025 compared to the older NCEP/CAS soil moisture outlook.
The NOAA monthly fire risk forecast is centered on the Northwest U.S. for September and Coastal California for October (Fig. 7-8). Given observations and trend, the West U.S. risk is likely expansive to include much of the Intermountain West. The outlook does not implicate the Northeast U.S. where significant rain, possibly from an inland moving tropical cyclone, is needed to prevent high fire risk. The October outlook may also be more expansive across the West and Northeast States.
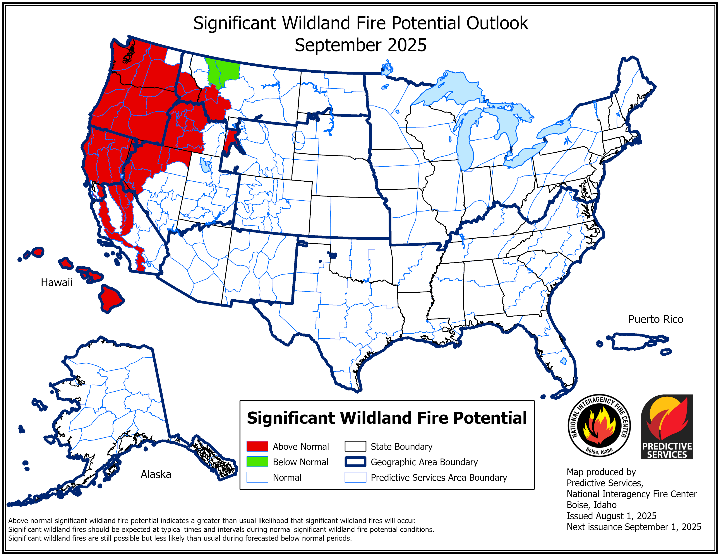

Fig. 7-8: NOAA monthly significant wildfire threat areas for September and October 2025.