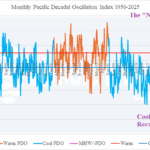
Record Strong Negative (Cool) Pacific Decadal Oscillation Observed in July!
08/06/2025, 2:58 pm EDT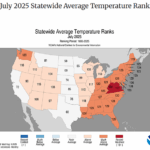
U.S. Climate Rankings for Each State in July
08/12/2025, 9:37 am EDT
August 2025 Climate Impact Company Global Soil Moisture Outlook
Issued: Sunday August 10, 2025
Highlight: Canadian Prairies wetter, monitoring short-term heat Central/East-central U.S. but drought development unlikely, West Europe drought.
Executive summary: Big changes in drought risk forecasts begins with the Canadian Prairies where fear of a major drought to close the season is canceled. Wetter than normal soil conditions are (now) likely. Similarly, the U.S. Spring Wheat zone is likely to avoid significant drought. Hot and dry weather plagues parts of U.S. hard red winter wheat, soybean, and corn areas in August to September. However, generally wet soil conditions are likely sufficient to prevent and serious drought from developing. Another change is the presence of drought or threat of drought for many Europe Crops stretching eastward to Ukraine and Southwest Russia. Mid-summer rains have helped parts of central and eastern Europe otherwise drought will continue especially West to Central Europe.

Fig. 1: July 2025 global soil moisture anomalies and 3-month trend.
Observation discussion: Striking is the amount of WET soil moisture regions across the globe just after mid-year (Fig. 1). The central and eastern U.S. are much wetter and any important drought conditions have disappeared except for Southern Florida. In the U.S., the western states are encountering a severe drought which is worsening. The Canadian Prairies have unexpectedly shifted wetter while Southwest Canada is drier.
In South America, Much of Brazil remains in drought. Argentina has shifted wetter during the past several months. Chile long-term drought is ongoing.
Western Russia has shifted wetter during the mid-year, and the focus of drought has emerged in West Europe extending eastward to interior southeastern Europe.
West tropical Africa has shifted drier mid-year while areas to the north remain wetter than normal. South Africa is steadily wetter than normal.
Soaking wet soil conditions are observed across India and Southeast Asia with a much wetter trend observed during the summer season. East-central China drought developed although Coastal China is wet.
Western Indonesia shifted drier during the past several months while Southern Australia dryness is a little stronger.
Forecast discussion: The outlook for the next 3 months (AUG/SEP/OCT) indicates wet risk for the East and Southeast U.S. driven in-part by tropical cyclone risk (Fig. 2). The West U.S. drought is likely to continue worsening. Western Canada shifts wetter heading into the autumn season.
In South America, the East Brazil drought continues while central/west portions turn wet. The Chilean drought worsens.
Europe shifts drier from Western Europe to Germany and Southwest Russia. Southeast Europe, West Turkey, and parts of the Black Sea region trend wetter. The North Coast of Eurasia will turn much wetter and Northern Siberia drought eases.
Dryness in tropical Africa, especially south of the equator develops. Northeast Africa to India is wetter. Southeast Asia wet soil conditions continue through the next several months including all of Indonesia. A wet climate is also expected across Australia.

Fig. 2: The July 2025 global soil moisture ranking percentile and 3-month soil moisture forecast.
| Crop Area | August 2025 | October 2025 | December 2025 |
| Canada Spring Wheat/Soybeans | 30-35% | 20-25% | 15-20% |
| U.S. Spring Wheat | 35% | 35% | 30% |
| U.S. Hard Red Winter Wheat | 20-25% | 35-40% | 35% |
| U.S. Corn/Soybeans West | 20-25% | 35% | 25-30% |
| U.S. Corn/Soybeans East | 20-25% | 25-30% | 20-25% |
| Europe Wheat/Corn/Soybeans West | 55-60% | 55-60% | 50% |
| Europe/Wheat/Corn/Soybeans East | 55-60% | 50-55% | 40-45% |
| Ukraine | 50-60% | 55% | 40-45% |
| Russia Spring Wheat West | 30% | 25-30% | 25% |
| Russia Spring Wheat East | 30% | 25-30% | 20% |
| Russia Winter Wheat/Soybeans | 50-55% | 50% | 40% |
| China Wheat/Corn South & Soybeans | 45-55% | 40-50% | 30-35% |
| China Wheat/Corn North | 25-35% | 25-35% | 25-35% |
Table 1: Primary northern hemisphere crop regions and risk of drought through December 2025.
| Crop Area | August 2025 | October 2025 | December 2025 |
| 1st Corn Brazil | 65-75% | 60-70% | 50-55% |
| 2nd Corn Brazil | 45-70% | 40-60% | 40-50% |
| Brazil Coffee | 70% | 65% | 55% |
| Soybeans Brazil/Wheat | 25-45% | 30-45% | 40-50% |
| ARG/Wheat/Corn/Soybeans | 35-45% | 30-40% | 35-45% |
| Africa Cocoa | 30-40% | 55-60% | 45-55% |
| NW Africa Winter Wheat | 60-70% | 60-70% | 50-60% |
| Southeast Africa Soybeans | 30-35% | 40-45% | 40-45% |
| Australia Wheat | 25-35% | 15-30% | 25-35% |
Table 2: Primary southern hemisphere crop regions and risk of drought through December 2025.
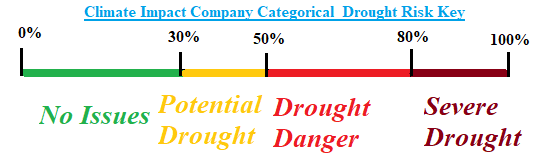
Table 2: Drought risk key.