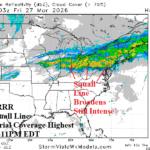
Tonight’s Ohio Valley Severe Weather Peak Intensity/Timing
03/26/2026, 12:43 pm EDT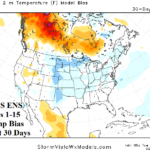
AIFS ENS 15-Day Temperature Forecast Bias across North America
03/31/2026, 6:51 am EDT
Climate Impact Company Early AG Market ALERT
Issued: Friday March 27, 2026
Highlight: Great Plains/East-central U.S. rainfall forecasts are problematic.
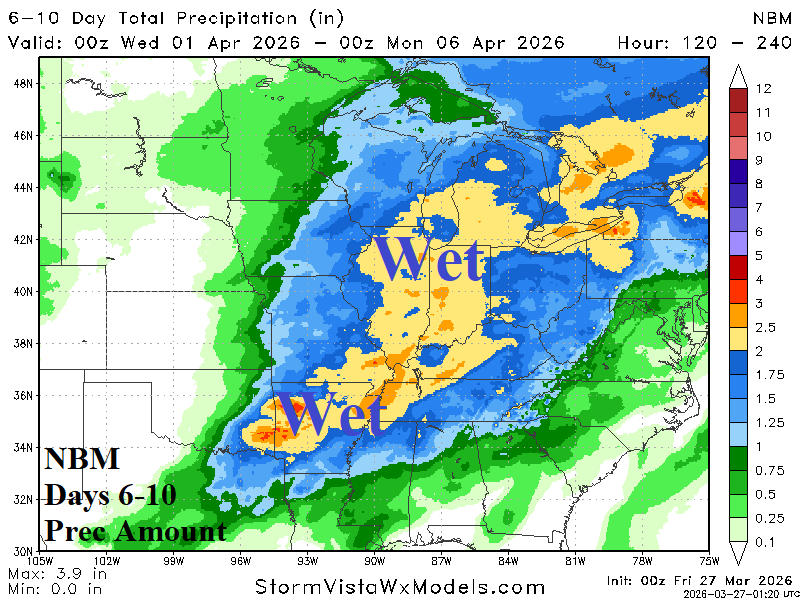
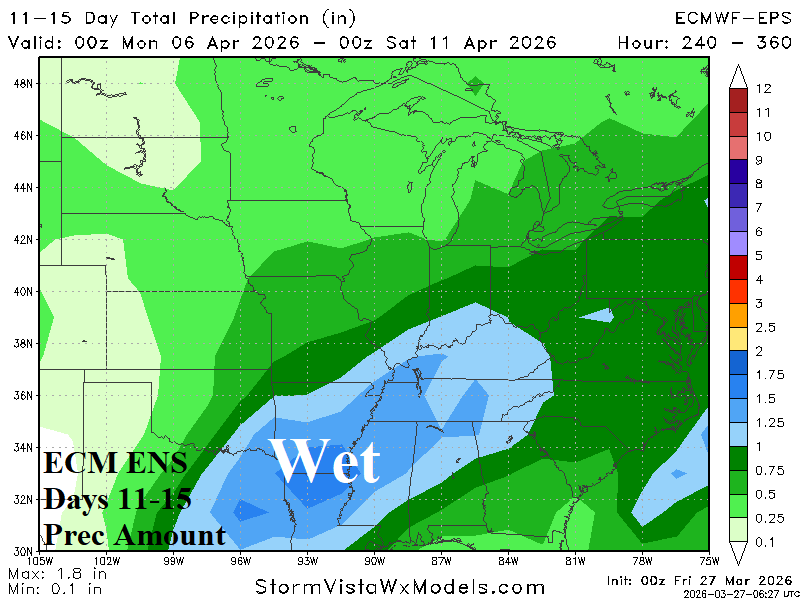
Fig. 1-2: NBM 6-10-day rainfall amount forecast followed by projected rainfall in the 11-15-day period by ECM ENS.
Discussion: Of significant interest is the rainfall pattern in the Great Plains as April arrives. So far, meteorological spring has featured unseasonably warm weather and limited rainfall accelerating dry soil conditions. Forecast models have projected a wetter pattern as April arrives. However, due to lack of ideal tropical forcing, the lower forecast amounts and eastward bias of the wet zone ahead is preferred. The NBM model is relied upon to project the 6-10-day period rainfall which indicates a general 2-3-inch swath of rain from Arkansas northeastward to the Ohio Valley (Fig. 1). Other models are farther west with heavier amount. In the 11-15-day period, ECM ENS is preferred indicating moderate rains for East Texas and the Mid-south U.S. (Fig. 2). A fine line between wet and dry weather keeps the west/southwest Great Plains dry during the period. In the extended range, Graph Cast is preferred by emphasizing moderate rain centered on southeastern Kansas for the 16-30-day period (Fig. 3) while CFS V2 indicates prohibitive rainfall centered on the same location (Fig. 4). The issue is lack of convincing tropical forcing to cause the heavier amount. The Madden Julian oscillation (MJO) is key to the forecast and indicates a transitional 2-week pattern (Fig. 5), unable to establish a tropical connection to the U.S. precipitation pattern. However, the southern oscillation index (SOI) finally shifts to negative phase in April (Fig. 6) which indicates El Nino should organize and a wet bias in the southern latitudes acting as a moisture source for the Great Plains could generate.
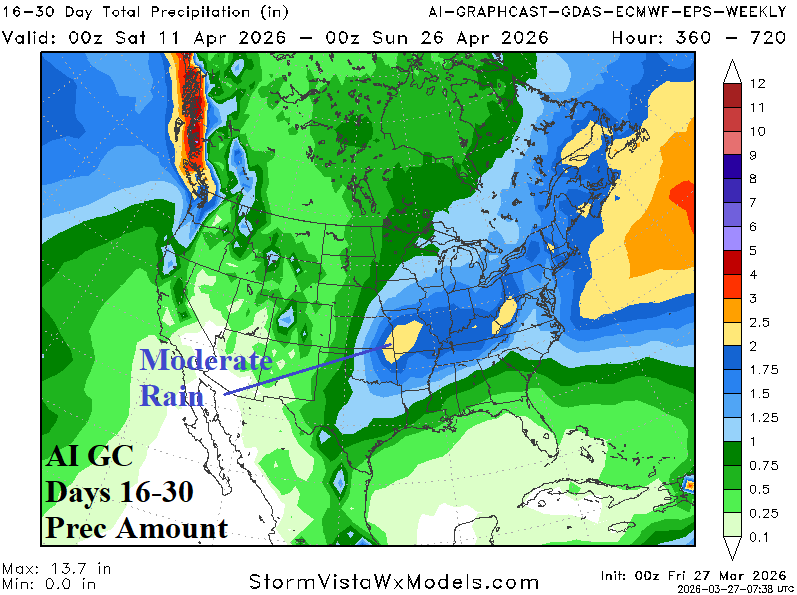
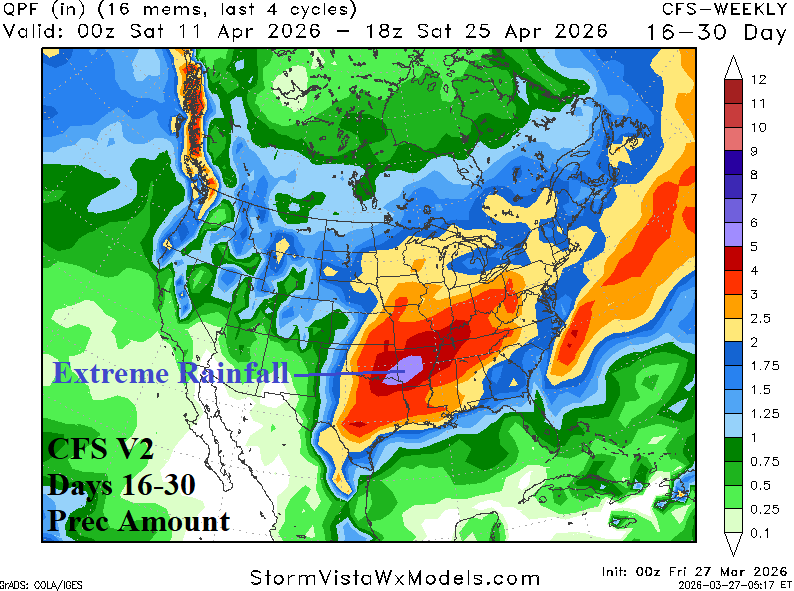
Fig. 3-4: The AIG Graph Cast and CFS V2 16-30-day precipitation amount forecasts for the U.S.
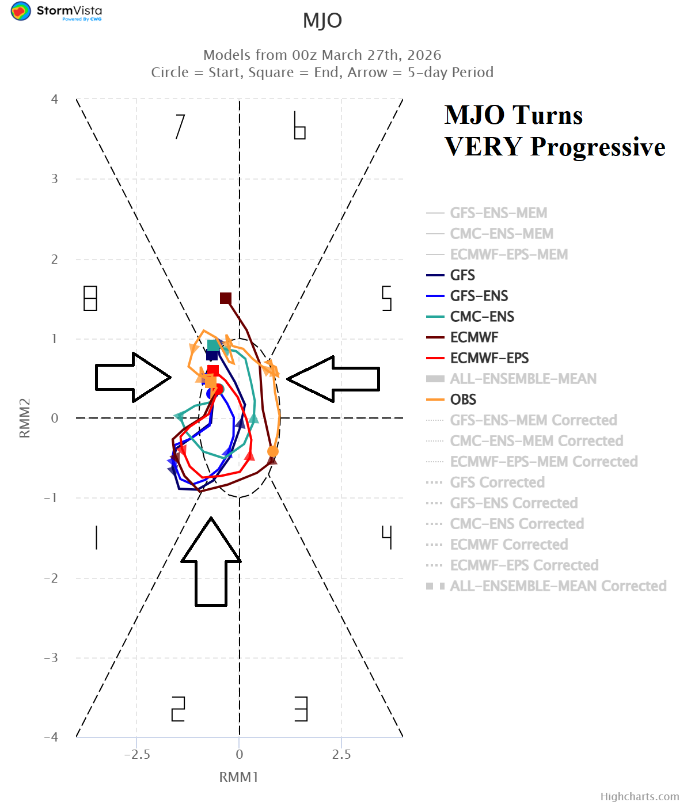
Fig. 5: The 15-day Madden Julian oscillation forecast indicates an unusually progressive to the east signature.
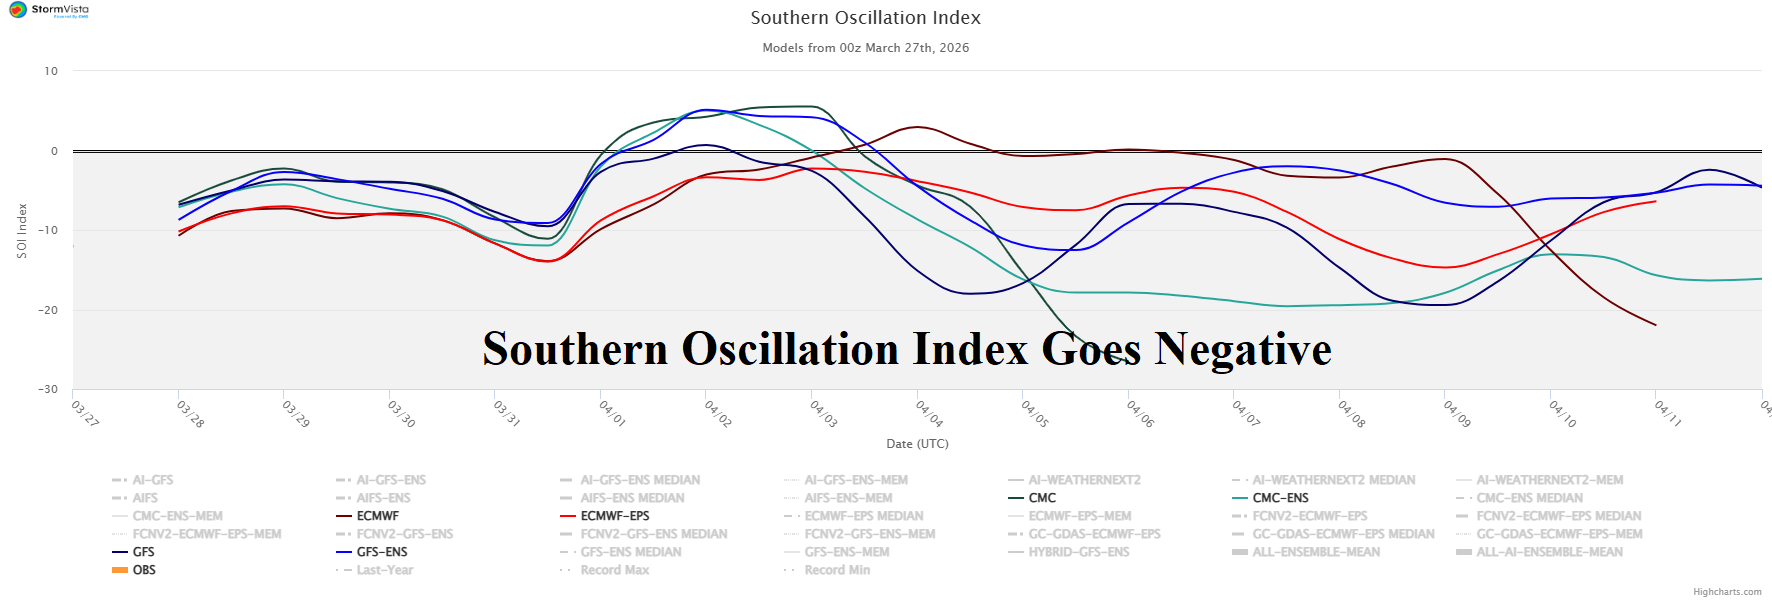
Fig. 6: The 15-day southern oscillation index forecast indicates negative phase supportive of developing El Nino.