Imelda Flooding Rainfall Remains in Forecast; New Concern is Long-duration East Wind Causing Flooding
09/27/2025, 9:30 am EDT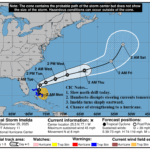
Direct Effects from Imelda and Humberto Stay Offshore the East U.S.
09/29/2025, 6:16 am EDT
Climate Impact Company Sunday AG Report
Global Weather/Climate Report
Issued: Sunday September 28, 2025
Highlights: Expanding Midwest to South U.S. drought.
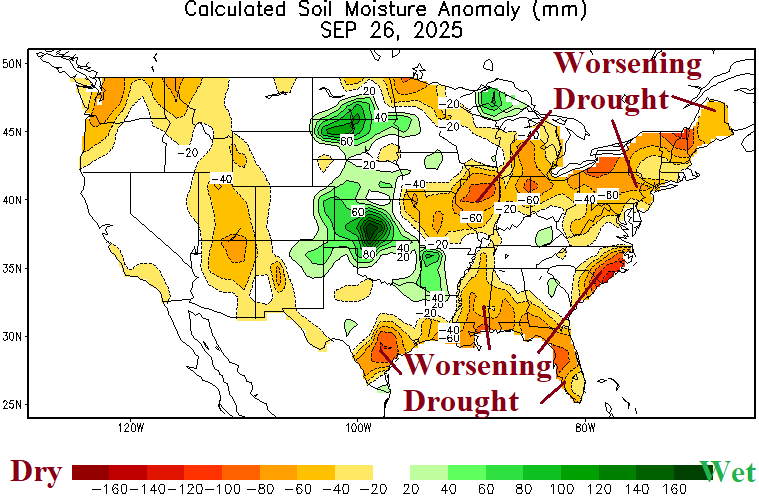
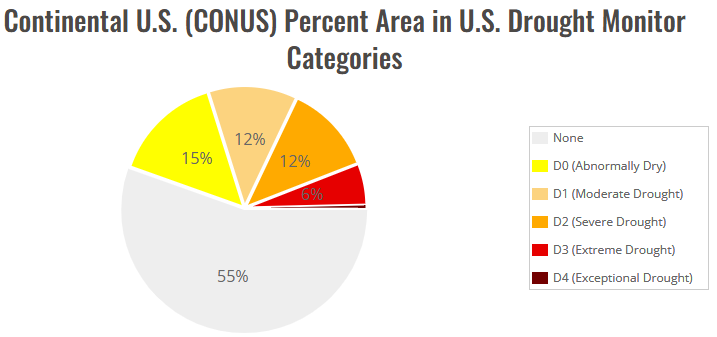
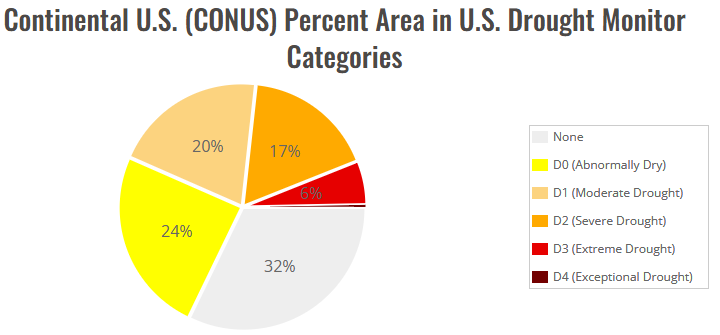
Fig. 1-3: Daily U.S. soil moisture anomalies analysis and the precent of the U.S. in drought during mid-August compared with late September.
Discussion: The late summer season drought in the Midwest States is strengthening (Fig. 1). Dry-to-drought conditions have also developed and are intensifying in the Gulf Coast and Northeast regions. The late summer new drought generation has caused a shift in U.S. regions observing drought from 45% in mid-August to nearly 70% during late September (Fig. 2-3). The U.S. precipitation outlook utilizing CMC ENS through the next 15 days stays very dry from the Gulf States (except Florida) to the Northeast U.S. as drought strengthens (Fig. 4). In the extended range, the ECM 16-30-day forecast stays mostly drier than normal South and East (Fig. 5).

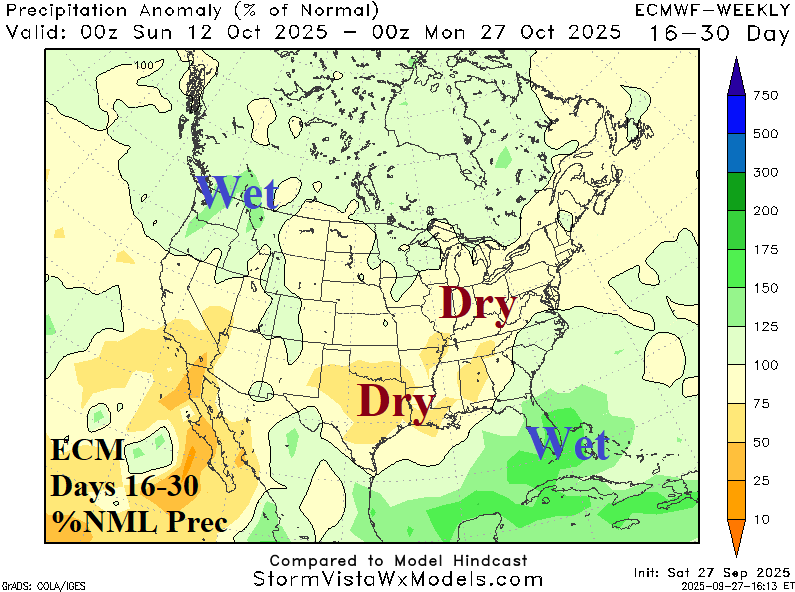
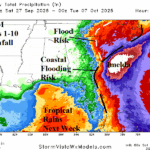
Fig. 4-5: The CMC ENS 15-day percent of normal rainfall outlook for the U.S. and ECM “weeklies” 16-30-day rainfall forecast.