The Largest U.S. Climate Problem? Western U.S. Water Supply!
03/29/2026, 10:32 am EDT
![]()
Climate Impact Company 2026 North Atlantic Basin
Tropical Cyclone Outlook
Issued: Thursday April 2, 2026
Highlight: 2nd least active year (of past 11); Significant East Coast hurricane; Watching for cross-over Mexico into the western Gulf of Mexico systems.
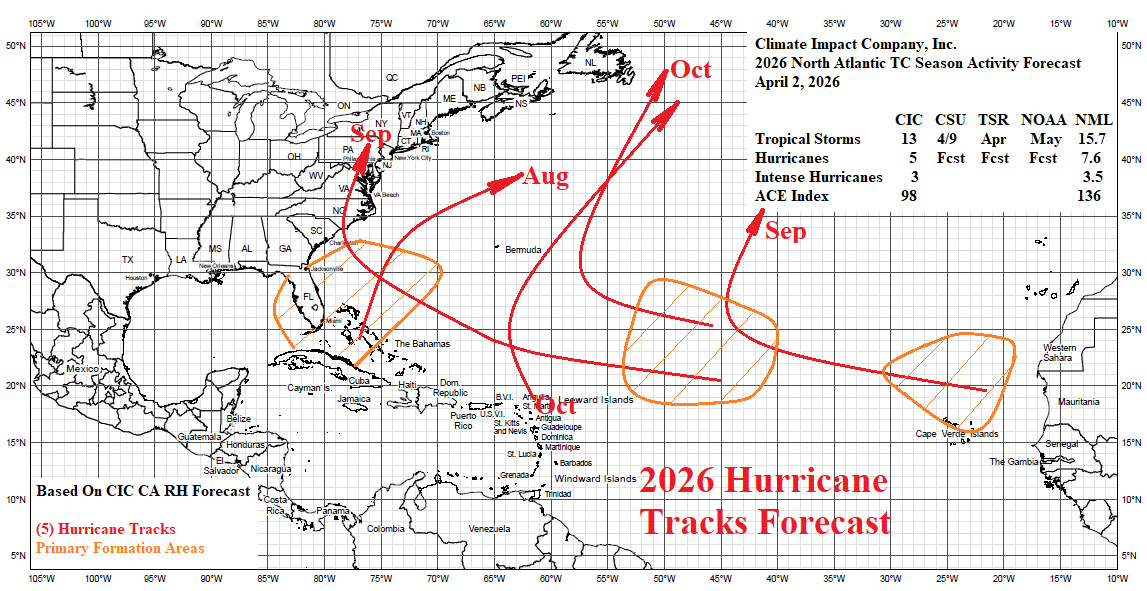
Executive summary: The initial North Atlantic basin seasonal activity forecast for the North Atlantic basin by Climate Impact Company is issued. The forecast is updated in late May as the onset of tropical cyclone season arrives and again near August 1st when the onset of highest seasonal activity arrives. The forecast projects 13 tropical storms, 5 hurricanes, and 3 intense hurricanes. An El Nino episode develops during the tropical cyclone season inhibiting development and 2026 is the second least busy year during the 2016-2025 active period. The constructed analog indicates a significant tropical cyclone risk landfalling during August on the East Coast. Due to the vigorously warmer than normal southeastern North Pacific there is an unusual risk of a cross-over Mexico tropical system reforming in the western Gulf of Mexico. Due to El Nino-inspired upper shear, the deep tropics are quiet this season.
Climate discussion: Well-known is the suppressing effect (due to upper-level westerly wind shear) on North Atlantic basin tropical cyclones by an El Nino climate (Fig. 1). El Nino is forecast by most dynamic models for the 2026 tropical cyclone season (Fig. 2). The intensity forecast rivals the strong El Nino’s of 1997-98 and 2015-16. The catalyst to the potential impressive El Nino ahead is the immense upper ocean heat across the equatorial East Pacific Ocean which identifies the potential energy available to fuel a robust El Nino (Fig. 3). Forecast confidence on El Nino 2026 will improve sharply with the early June update. However, ENSO phase is likely an inhibiting factor to tropical cyclone activity in 2026.
The North Atlantic basin is marginally warm (+0.28C) and continues to cool as April arrives (Fig. 4). The bulk of the anomalous warmth is across the northern Gulf of Mexico and east of the Bahamas. The main development region (MDR) for North Atlantic hurricanes located between the eastern edge of the Caribbean Sea and Northwest Africa is exactly normal entering April. Upper ocean heat in the North Atlantic tropics has recently cooled too near normal (Fig. 5). Upper ocean heat in the Gulf of Mexico is below normal.
The ECMWF global SSTA forecast for JUL/AUG/SEP 2026 projects (anomalous) warming of the Gulf of Mexico and the Bahamas eastward to south of Bermuda while the deeper tropics are mixed neutral to warmer than normal (Fig. 6). Similarly, upper ocean heat in the deep tropics is projected near-to-slightly above normal. The tropical/subtropical North Atlantic SSTA forecast for the tropical cyclone season, coupled with El Nino, suggests the best location for tropical cyclone development and intensification during the 2026 season is in the subtropics.
The precipitation probability forecast across tropical Africa during JUL/AUG/SEP by the International Research Institute for Climate and Society indicates while the Northern Desert areas are wetter than normal implying below normal risk of a Saharan Dust issue to inhibit tropical wave development, tropical Africa is drier than normal suggesting tropical waves entering the outer North Atlantic basin tropics are weaker and less abundant than normal (Fig. 7).
Coupled with the El Nino warming of the tropical East Pacific is expansion of one of the strongest marine heat waves (MHW) off the West Coast of North America into the southeastern North Pacific. Although El Nino suppresses Gulf of Mexico tropical cyclone risk, the much warmer than normal waters off the southwestern coast of Mexico suggest above normal frequency and strength of tropical systems during the 2026 season potentially sufficiently powerful to cross Mexico and reform in the western Gulf of Mexico.
The quasi-biennial oscillation (QBO) will be in transition into the positive phase during the 2026 tropical cyclone season. Once into the positive phase (during AIG/SEP/OCT) ventilation in the upper atmosphere to enhance tropical cyclone activity is favored in the deep tropics while suppressed in the subtropics.
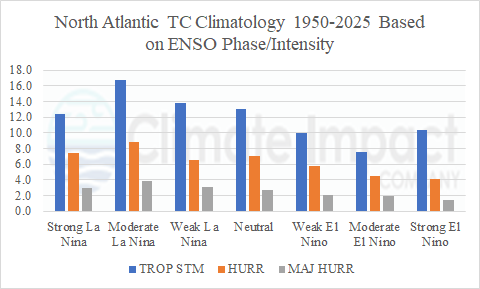
Fig. 1: The North Atlantic basin seasonal tropical cyclone activity based on ENSO phase and intensity.
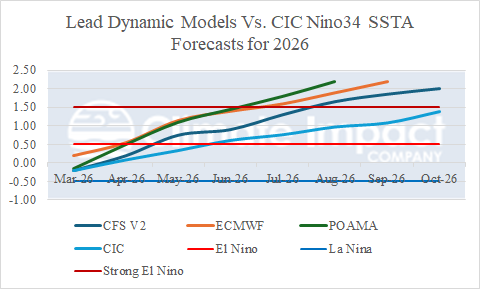
Fig. 2: Leading dynamic forecast models and their Nino34 SSTA forecasts project an intense El Nino in 2026. The Climate Impact Company forecast is less robust.
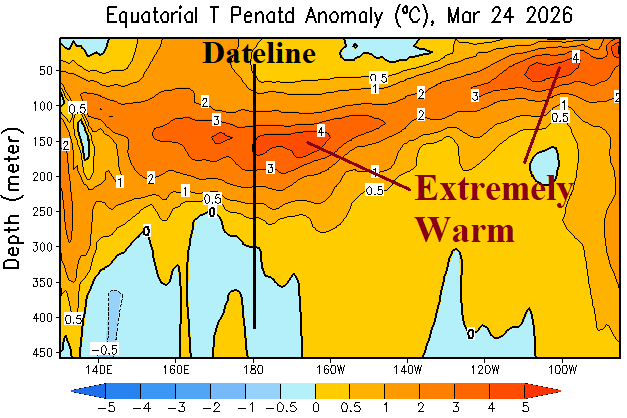
Fig. 3: The equatorial Pacific Ocean subsurface upper ocean heat anomalies.
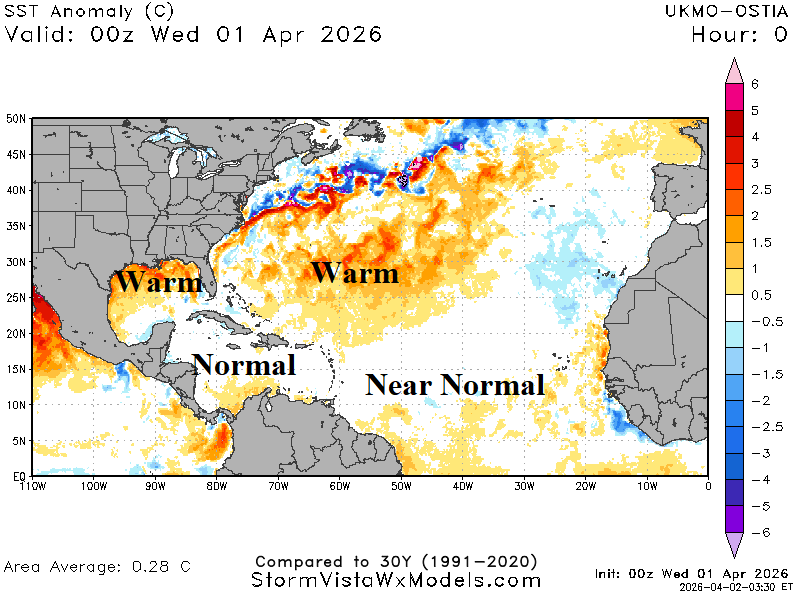
Fig. 4: The current North Atlantic basin SSTA analysis.
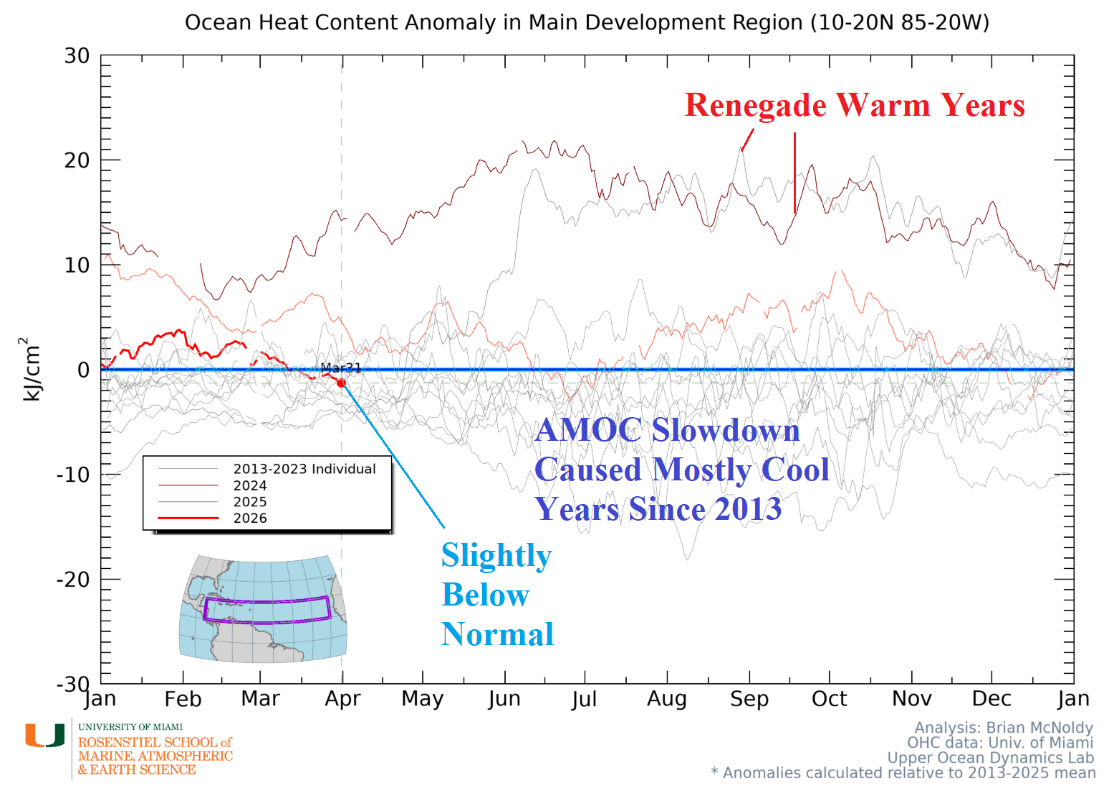
Fig. 5: The upper ocean heat anomalies across the North Atlantic tropics for 2013-2026.
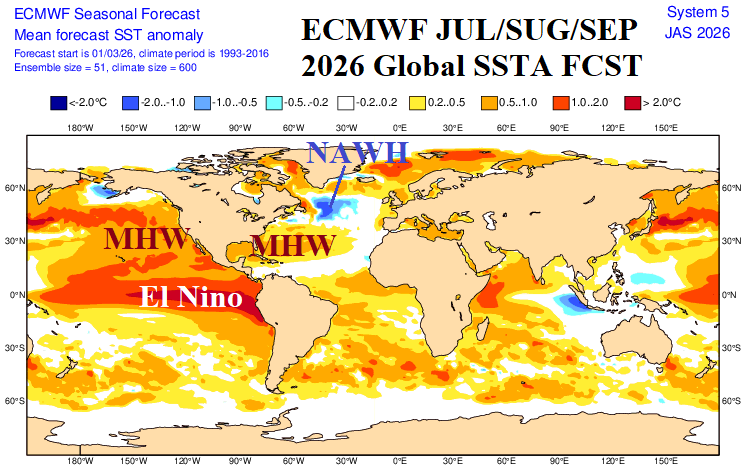
Fig. 6: The ECMWF global SSTA forecast for JUL/AUG/SEP 2026.
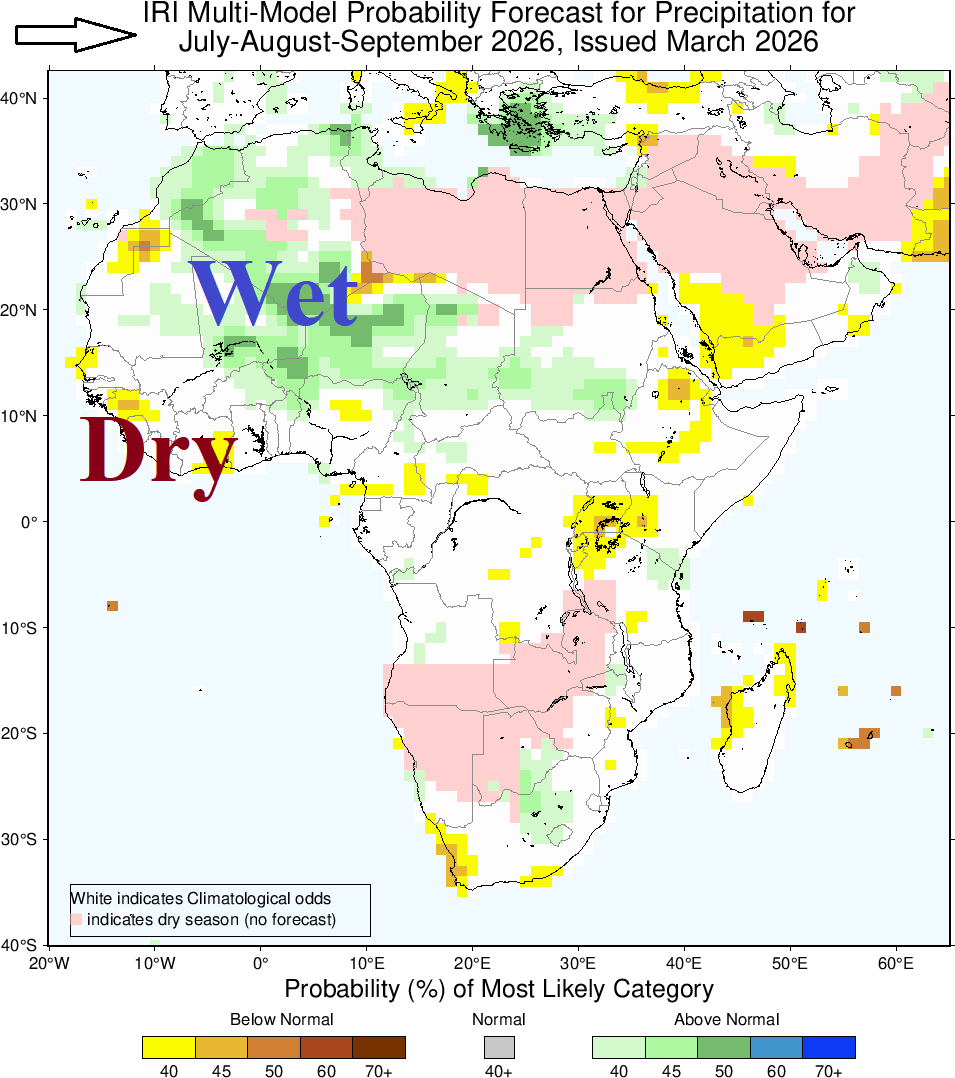
Fig. 7: The IRI/LDEO precipitation probability forecast for Africa valid JUL/AUG/SEP 2026.
Climate summary: The constructed analog forecast of seasonal tropical cyclone activity (Table 1) across the North Atlantic basin in 2026 is based on the presence of El Nino, warmer than normal SSTA in the Gulf of Mexico eastward to south of Bermuda, while the subtropics are near normal, and outer tropics warmer than normal for the core of the 2026 season. El Nino inhibits activity while warm SSTA support over-achieving intensity of storms passing through the warmer waters especially if SST reach or exceed 86F/30C (expected in the Gulf of Mexico). Strong tropical waves off the West Africa Coast with potential to become hurricanes are less likely to occur during the 2026 season. The unusual crossing of tropical cyclones moving into Southern Mexico and redeveloping in the western Gulf of Mexico is possible this season.
| Enhanced Activity | Neutral Influence | Suppressed Activity | |
| ENSO | X | ||
| Deep tropics SSTA | X | ||
| Subtropics SSTA | X | ||
| West Africa Rain | X | ||
| QBO | X (low confidence) | ||
| East Pacific SSTA | X (Gulf) |
Table 1: Predictors used for the Climate Impact Company 2026 North Atlantic basin seasonal tropical cyclone season forecast.
Analog years: Due to the warming of the global oceans, particularly during the past 10-15 years, analog years selected from the middle 1990’s to middle 2020’s (only). Due to the strong El Nino forecast by most dynamic models, the powerful 1997 and 2015 El Nino years is considered in the forecast. However, there is no guarantee El Nino will reach high level intensity therefore weaker El Nino’s are (also) considered (2002, 2004, and 2023). Due to similarities of the forecast SSTA in the Northeast North Pacific basin in 2026 the “warm blob” years 2014 and 2015 are added to the El Nino analog years. The analog years selected for the North Atlantic basin (2015 and 2019) are based on anomalous warm subtropics, near to above normal deep tropics, and presence of a strong North Atlantic warm hole (NAWH) south of Greenland. The West Africa rainfall analog years are 2015 and 2023 (also) matching El Nino (climate). The last year when entering positive phase QBO during the tropical cyclone season during an El Nino climate was 2015.
Activity forecast discussion: The 2026 Climate Impact Company North Atlantic Basin 2026 seasonal tropical cyclone forecast is 13 tropical storms, 5 hurricanes, and 3 major hurricanes (Table 2). The accumulated cyclone energy (ACE) index forecast is 98. The outlook is for below normal (Table 3) and (considerably) below the active pattern of the past 10 years. Using the projected ACE index, the 2026 season forecast ranks 2nd least active of the past 11 years.
| Year | Weight | Tropical Storms | Hurricanes | Major Hurricanes | ACE Index |
| 2023 | 2 | 20 | 7 | 3 | 146 |
| 2019 | 18 | 6 | 3 | 132 | |
| 2015 | 4 | 11 | 4 | 2 | 63 |
| 2014 | 8 | 6 | 2 | 67 | |
| 2004 | 15 | 9 | 6 | 227 | |
| 2002 | 12 | 4 | 2 | 67 | |
| 1997 | 8 | 3 | 1 | 41 | |
| Average | 13.2 | 5.3 | 2.6 | 98.0 | |
| Forecast | 13 | 5 | 3 | 98 |
Table 2: The analog years and their weighting used to generate the Climate Impact Company 2026 North Atlantic basin seasonal tropical cyclone season forecast.
| Tropical Storms | Hurricanes | Major Hurricanes | ACE Index | |
| 2026 Forecast | 13 | 5 | 3 | 98 |
| Last Year | 13 | 5 | 4 | 133 |
| 50-Year NML | 13.3 | 6.7 | 2.8 | 110.0 |
| 30-Year NML | 15.7 | 7.6 | 3.5 | 131.6 |
| 10-Year NML | 18.2 | 8.2 | 3.9 | 149.3 |
| El Nino | 8-10 | 4-6 | 1-2 | 65-80 |
Table 3: The Climate Impact Company 2026 North Atlantic basin tropical cyclone season activity forecast compared to various climatology.
Development areas/tracks discussion: To estimate where tropical cyclones form and track during peak months of July to October, the analog years are used to project mid-troposphere (600 MB) relative humidity anomalies to identify areas favorable for convection supporting tropical cyclone presence and subsidence where tropical cyclones are not likely. In July, the constructed analog reveals tropical cyclone risks for either side of Florida with most the west and south portions of the North Atlantic basin dry and lacking tropical cyclone risk (Fig. 8). A similar forecast with July is forecast for August as significant low risk of tropical cyclones for the Gulf of Mexico, Caribbean Sea, and the deep tropics (Fig. 9). However, in August, tropical cyclone generation in the subtropics off the Southeast U.S. Coast is expected. The outlook for September is ominous with a long stretch of wet mid-troposphere conditions extending from the Cape Verde Islands to the Atlantic Seaboard (Fig. 10). Implied is 1 or 2 long-distance traveling tropical systems sometimes referred to as “Cape Verde Storms” which usually are powerful hurricanes. In September, Northern Florida to Virginia are implicated for 1 or 2 significant tropical cyclones. In October, a rare cross-Mexico tropical cyclone risk for the western Gulf of Mexico is indicated (Fig. 11). The threat could occur earlier in the season in this location. Late season activity northeast of Puerto Riso is also indicated.
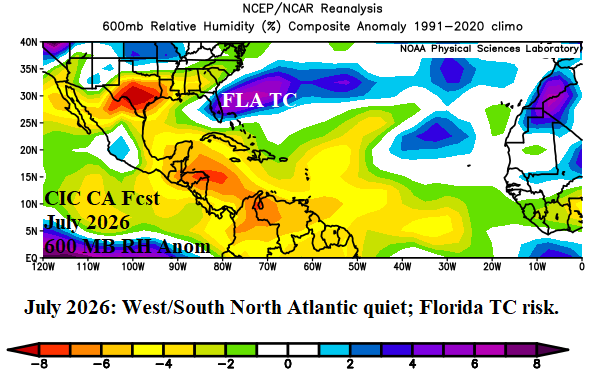
Fig. 8: The Climate Impact Company constructed analog forecast for 600 MB relative humidity anomalies to identify tropical cyclone formation areas and potential tracks for July 2026.
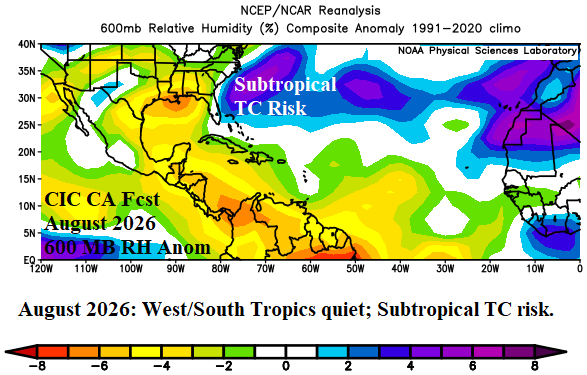
Fig. 9: The Climate Impact Company constructed analog forecast for 600 MB relative humidity anomalies to identify tropical cyclone formation areas and potential tracks for August 2026.
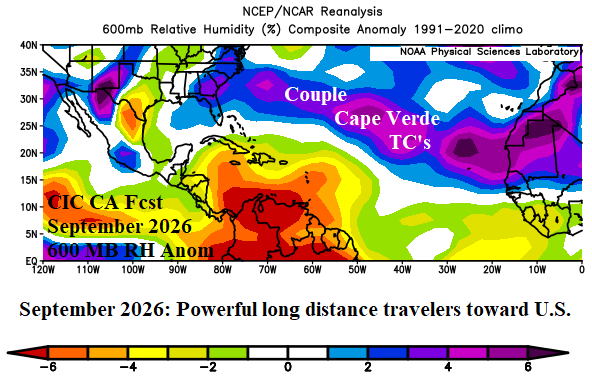
Fig. 10: The Climate Impact Company constructed analog forecast for 600 MB relative humidity anomalies to identify tropical cyclone formation areas and potential tracks for September 2026.
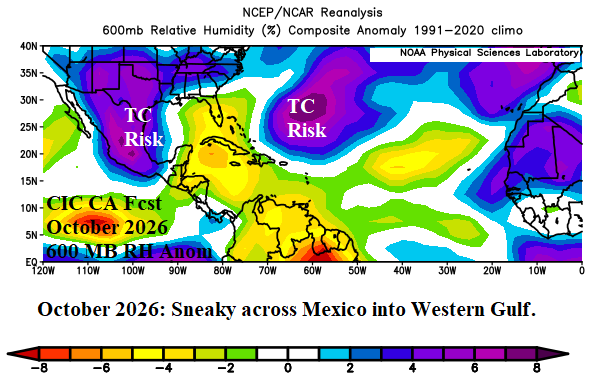
Fig. 11: The Climate Impact Company constructed analog forecast for 600 MB relative humidity anomalies to identify tropical cyclone formation areas and potential tracks for October 2026.