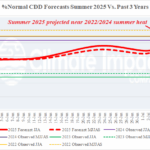
Impressive CDD’s for U.S. and Europe
07/07/2025, 4:58 am EDT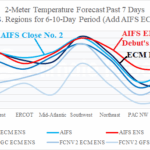
AIFS ENS Debuts at Number 1 Skill Scores U.S. Regions Days 6-10
07/13/2025, 9:27 am EDT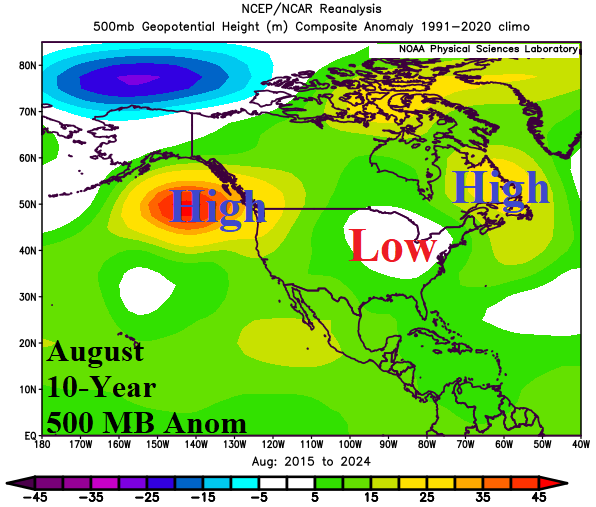

Climate Impact Company Week 2-4 Outlook
North America
Issued: Friday, July 11, 2025
Highlight: Trough into the East, most aggressively forecast by CFS V2 and AI.
Chart of the day: Using optimum climate normal to forecast pattern

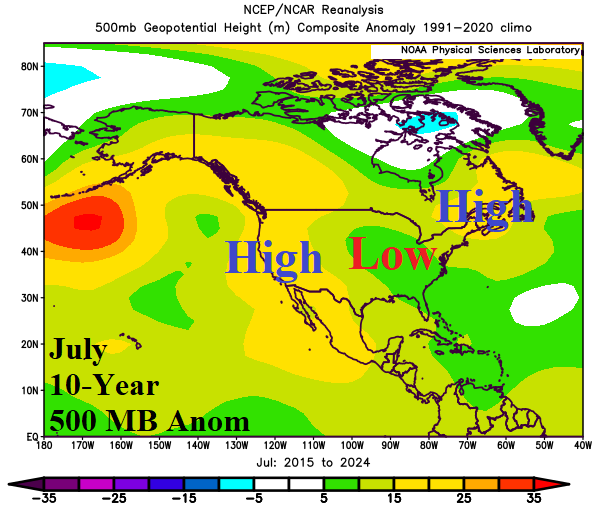


Discussion: Dynamic and AI forecast models are shifting an upper trough into the East during the week 2-3 ahead period. CFS V2 lingers the trough in week-4 while ECM and AI models regenerate a Northeast U.S. ridge at that time. Climate Impact Company recognizes optimum climate normal (OCN) when potential pattern change is forecast in the extended range. During the past 10 years (enhanced during the past 5 years), the upper air pattern has become persistent across North America producing a West Coast and Southeast Canada upper ridge and compensating trough in the Midwest States during July and strengthening this pattern in August. The high- pressure areas are linked to persistent much warmer than normal sea surface temperature anomalies (SSTA) in Northeast Pacific and western North Atlantic. Consequently, probabilistic climate forecasts almost always indicate warmer and wetter than normal in the East U.S. during JUL/AUG/SEP and a dry/hot risk in the West/Northwest U.S. OCN is a strong influence on climate forecasts nowadays especially during weak ENSO regimes. Dynamic models and certainly any machine learning processes are aware of this pattern.
Week-2 Ahead Forecast valid July 20-26, 2025: Cool into Midwest.


Discussion: CFS V2 (and some AI forecasts) are quite cool into the Midwest U.S. during the last week of July. Hot and dry weather is confined to the Northwest U.S. and emerges in Texas. A wet monsoon delivers thunderstorms to the Southwest U.S. and some of that moisture stretches to the U.S. Corn Belt. Tropical downpours on the East Coast are likely.
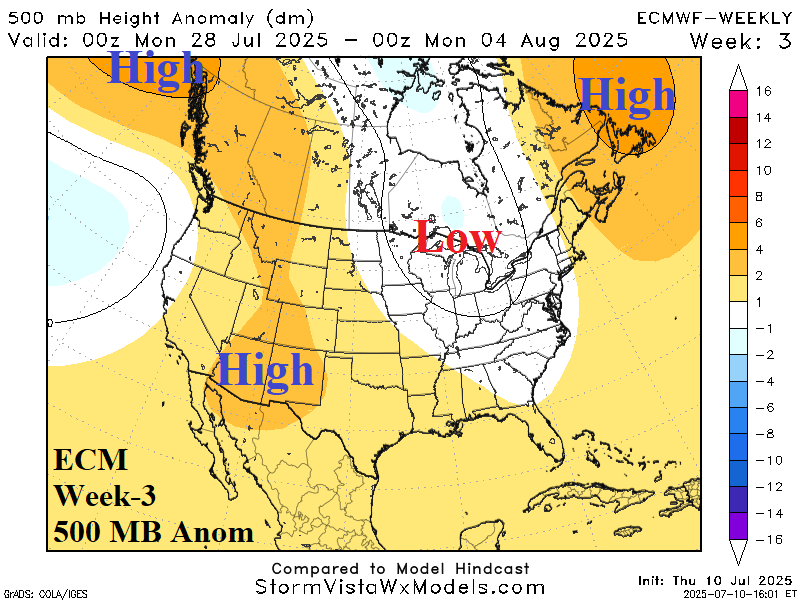
Week-3 Ahead Forecast valid July 27-August 2, 2025: Northwest/California and Texas heat; Temperate East.
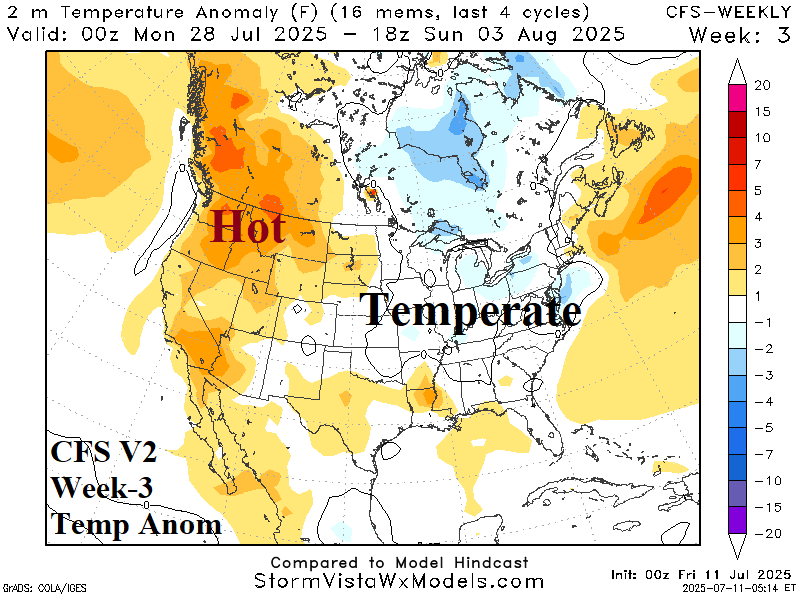
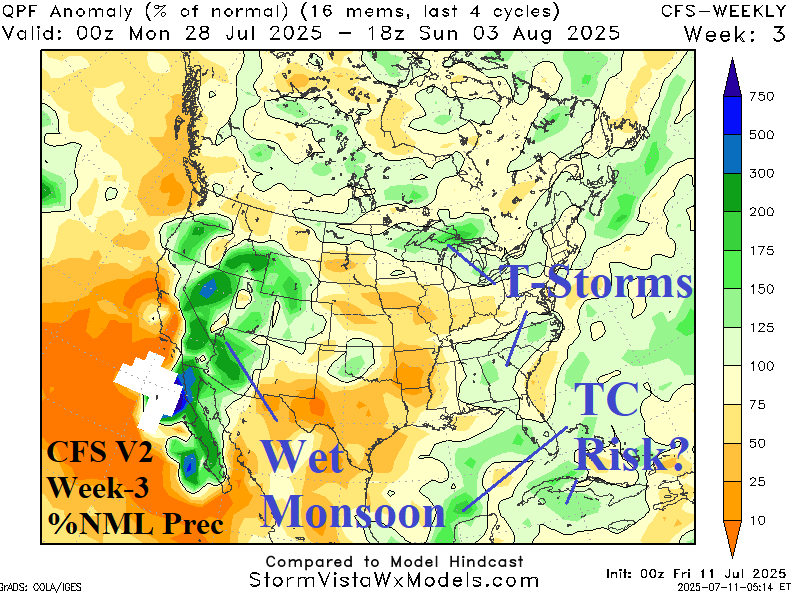
Discussion: Shifting into early August the cooling trough affecting the East lingers but moderates. The Northwest and California are hot! Monsoon thunderstorms continue to affect the Southwest. Tropical cyclone risk emerges in the Gulf of Mexico.
Week-4 Ahead Forecast valid August 3-9, 2025: Mostly near normal temperature.
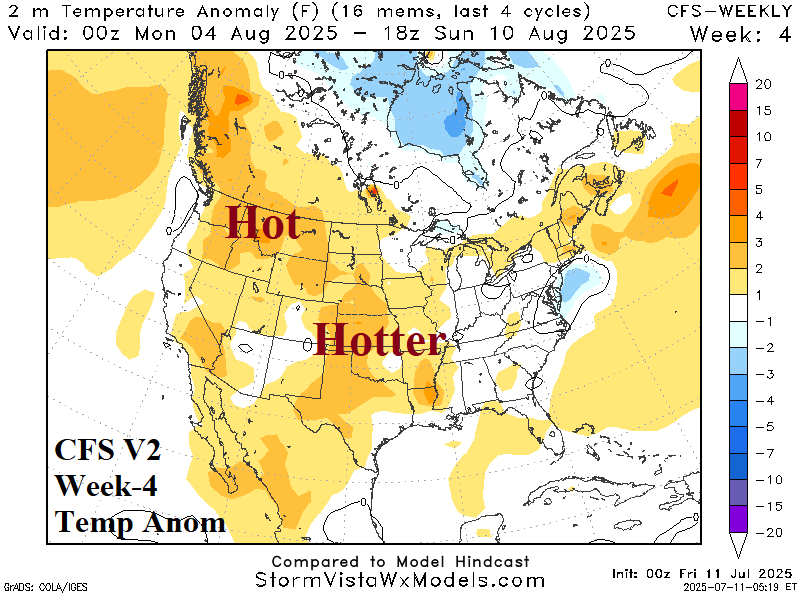
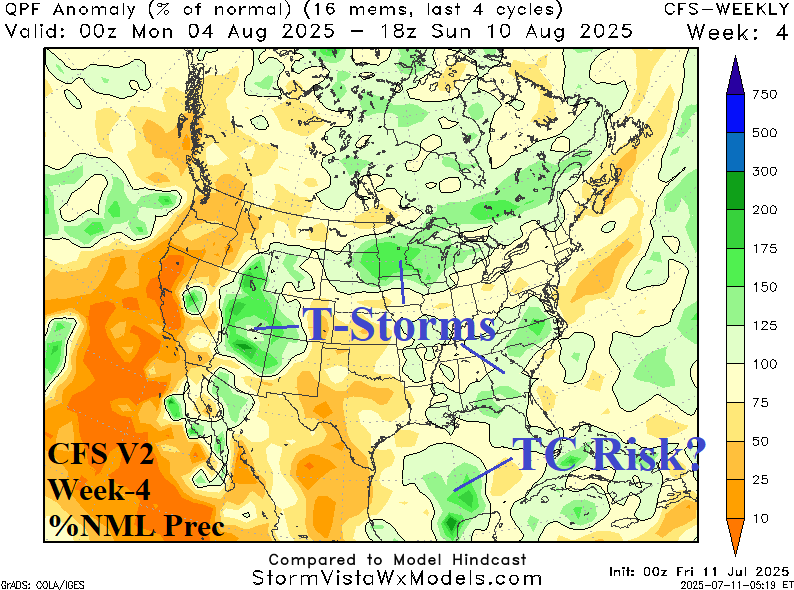
Discussion: The western heat extends to the Great Plains and the Northeast rewarms. Monsoon moisture is ejected northeastward to fuel thunderstorms across the Upper Midwest into Quebec. The Southeast States are thundery and the Gulf of Mexico features a marginal tropical cyclone risk.