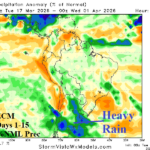
A Deluge of Rain for Argentina Ahead
03/17/2026, 8:00 am EDT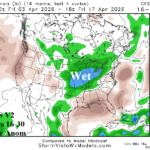
Central/East-central/Mid-south U.S. Shift Wetter Extended-range Forecast
03/20/2026, 8:39 am EDT
Climate Impact Company Gas/Power Report
Issued: Thursday March 19, 2026
Highlight: Hardest hit for energy demand during 2026 warm season is CAISO/WECC, followed by ERCOT through July, and NEPOOL/PJM-East late summer.
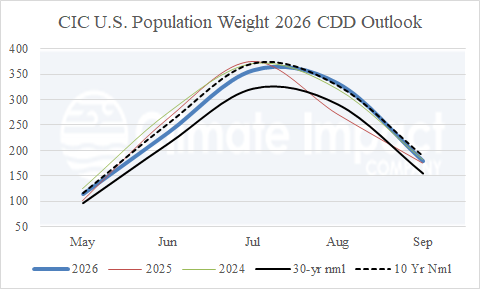
Fig. 1: Climate Impact Company 2026 warm season monthly U.S. population weight CDD projections compared to the 30-year/10-year normal plus 2025 and 2024.
Discussion: The effect of the Middle East War on energy supply and prices increases the value of U.S. cooling degree day projections for the 2026 warm season. Provided is a monthly discussion of expectations and charts for each NOAA/EIA region of the U.S.
April: Expect the “memory of winter 2025-26 pattern” to continue as chilly air, at times, visits the North-central to Northeast U.S. while south of that arc persistent warm to very warm climate is likely. The early season CDD count for the U.S. is 43 which is warmer than the 10-year (40) and 30-year (30) normal. The Texas region is warmest at 142 CDD (compared to the 30-year [94] and 10-year [127]) normal. If the Northeast Corridor is warmer than projected, the April CDD will exceed last year’s 48 CDD.
May: Although weaker, persistence is expected with the late meteorological spring climate. The Upper Midwest to Northeast U.S. is susceptible to periods of cool weather separated by increasingly (anomalous) warm periods. The West, and especially the Southwest, are very warm and possibly record warm to Texas. The Southeast is also very warm. The U.S. CDD projection is 121 which is above the 30-year normal (97) and 10-year normal (116) and warmer than last year (102). Once again, the jackpot for May CDD is the Texas region (290) which matches last May compared to the 30-year (252) and 10-year (284) normal. The Mountain and Pacific region are also much warmer than normal.
June: Searing heat, enhanced by drought, is expected across the West, South-central, and Southeast U.S. Periods of cool weather are confined to the Great Lakes to New England as the “memory of winter 2025-26” climate pattern (barely) hangs on. The June CDD projection is 246 which is very close to the warm 10-year normal (253). The temperate Northeast Corridor holds the national projection slightly below the 10-year normal. The strongest warm anomalies are (once again) across the Pacific, Mountain, and Texas region.
July: El Nino onset arrives and changes the climate pattern in some locations. The Northeast shifts much warmer, The Midwest is temperate and the Gulf States (anomalous) heat risk lowers, including Texas. The strongest anomalous heat in the West may tilt toward the Northwest States. The projected CDD for July is 355 compared to the 30-year (321) and 10-year (372) normal. The July forecast is not as hot as the past 3 years, which were 376, 370, and 371. The hottest regional anomalies remain in the Pacific and Mountain regions with significant increases, relative to normal, in the New England and Mid-Atlantic regions. Although the Northeast U.S. finally warms on a consistent basis, the New England/Mid-Atlantic regions are considerably less hot than the past 3 years.
August: The tendency is very warm to persistent hot and humid for the New England/Mid-Atlantic region while searing heat continues in the West, biased toward the Coast. The Central U.S. to Gulf States are susceptible to temperate periods and occasional heat holding down CDD totals. The August CDD projection for the U.S. is 322 which is similar with 2024 and 2023. The value is close to the 10-year normal (328). Strongest warm anomalies are in the Northeast and West U.S. The late summer excessive heat risk areas are California and the PJM-East/NEPOOL sectors.
September: The El Nino climate produced wet weather biased to the southern latitudes which can extend to the Mid-Atlantic States while the wet monsoon lingers in the Southwest U.S. The wet weather is (mostly) synoptic scale and not necessarily related to tropical cyclone risk. The most likely reginal candidates for above normal CDD is the Northwest U.S. due to drought and the Northeast U.S. due to persistent high humidity. The U.S. CDD projection for September is 178 which is in-between the 30-year (155) and 10-year (189) normal. West and Northeast regions are near or exceed the 10-year normal.
October: A warmer than normal bias lingers for most of the U.S., strongest in the West and East Coast. The U.S. CDD projection is 65, close to the (warm) 10-year normal (68).
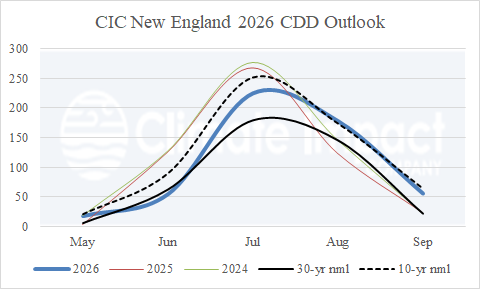
Fig. 2: Climate Impact Company 2026 warm season monthly CDD projections compared to the past 2 years and 30-year/10-year normal for New England. (NEPOOL)
 .
.
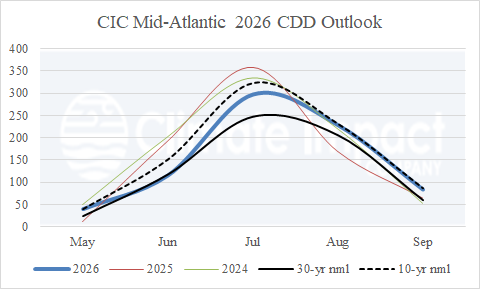
Fig. 3: Climate Impact Company 2026 warm season monthly CDD projections compared to the past 2 years and 30-year/10-year normal for the Mid-Atlantic U.S. (PJM-East)
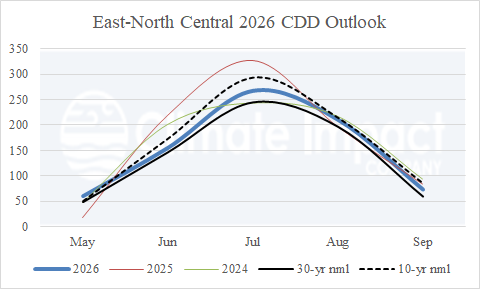
Fig. 4: Climate Impact Company 2026 warm season monthly CDD projections compared to the past 2 years and 30-year/10-year normal for the East-North-central U.S. (PJM-West)
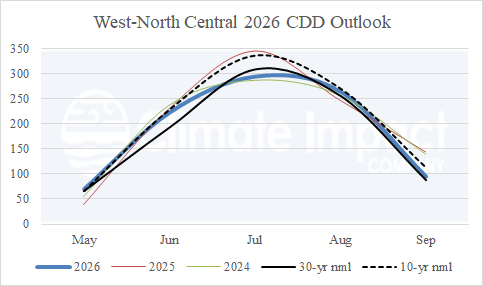
Fig. 5: Climate Impact Company 2026 warm season monthly CDD projections compared to the past 2 years and 30-year/10-year normal for the West-North-central U.S. (MISO)
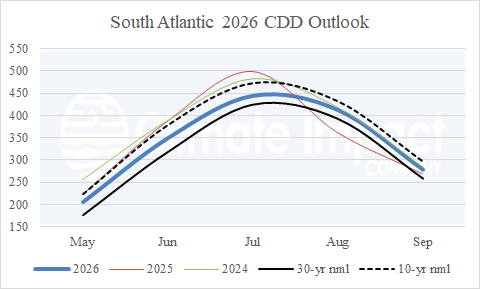
Fig. 6: Climate Impact Company 2026 warm season monthly CDD projections compared to the past 2 years and 30-year/10-year normal for the South Atlantic U.S. (SERC)
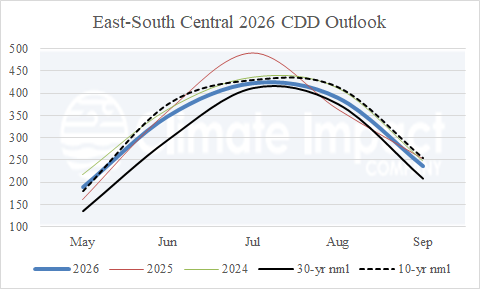
Fig. 7: Climate Impact Company 2026 warm season monthly CDD projections compared to the past 2 years and 30-year/10-year normal for the East-South Central U.S. (SPP)
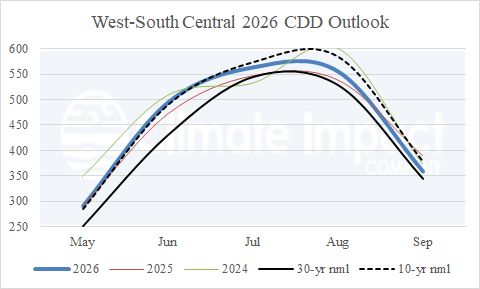
Fig. 8: Climate Impact Company 2026 warm season monthly CDD projections compared to the past 2 years and 30-year/10-year normal for the West-South Central U.S. (ERCOT)
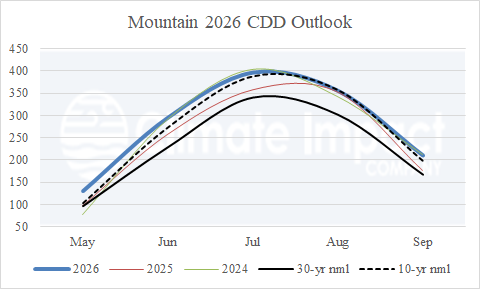
Fig. 9: Climate Impact Company 2026 warm season monthly CDD projections compared to the past 2 years and 30-year/10-year normal for the West-South Central U.S. (WECC)
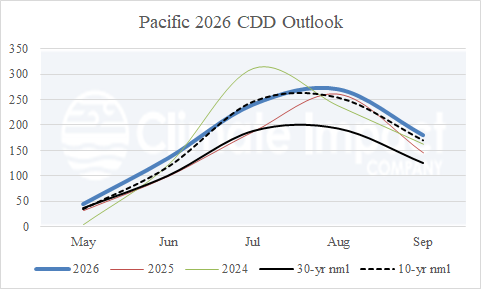
Fig. 10: Climate Impact Company 2026 warm season monthly CDD projections compared to the past 2 years and 30-year/10-year normal for the Pacific U.S. (CAISO)