AIFS ENS and ECM ENS Remain Top North America Medium-range Forecast Models
03/06/2026, 6:01 am EST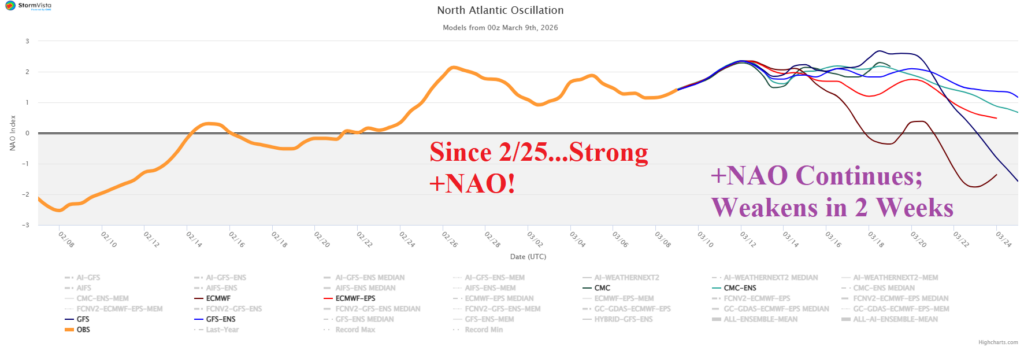

Climate Impact Company Early U.S. Notes
Highlight: -PNA/+NAO influences on U.S. climate; Severe weather early-to-middle week.

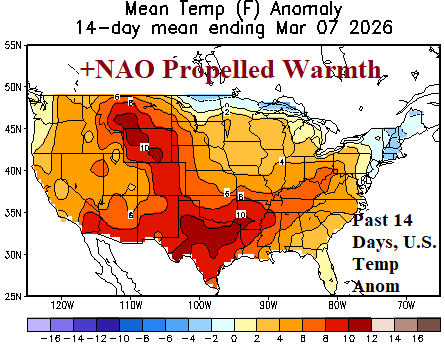
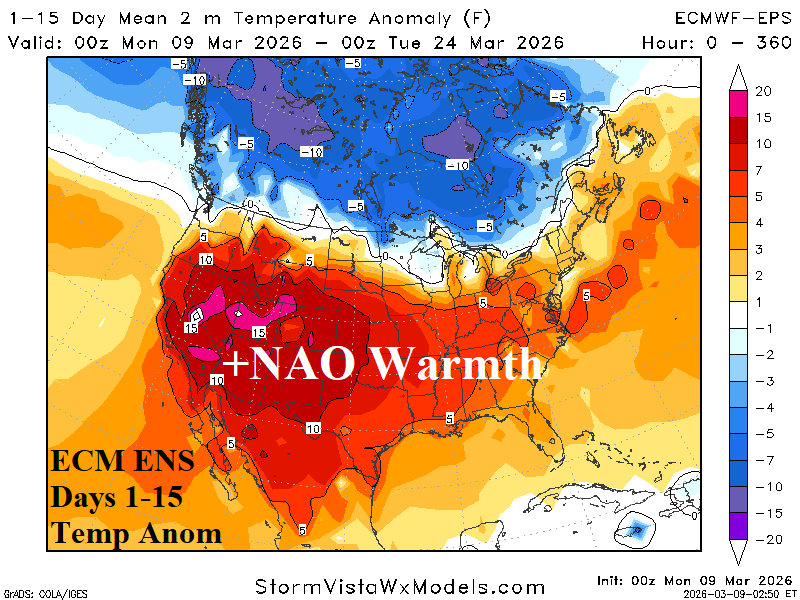
Fig. 1-3: Ongoing positive North Atlantic oscillation biases the U.S. climate pattern warm.
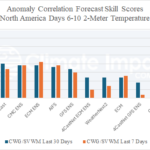
Discussion: Vigorous positive phase of the North Atlantic oscillation (Fig. 1) is the lead climate signal supporting the warm pattern across the U.S. during the past 14 days (Fig. 2). Although Canada is cold and some of the chill may affect the northeast quadrant of the U.S. in the medium range, the overall U.S. temperature scenario is warm (Fig. 3). The negative phase of the Pacific North America (-PNA) has dominated in recent weeks (Fig. 4) although under-performing as a wet/snowy weather maker in the Northwest/West U.S. while the attendant dry signal for the Southeast is strong (Fig. 5). Significant precipitation is forecast this week in the Northwest and East-central/Mid-south U.S. as -PNA strengthens. The -PNA pattern weakens next week, and a much drier pattern follows. Note the over-forecasting nature of forecast models in the Northwest and Southeast during the past 14 days (Fig. 6).
NOAA/SPC projects an expansive severe weather outbreak tomorrow from Texas to the southern Great Lakes region (Fig. 7). The highest risk of tornadoes is across North-central Illinois. Excessive rainfall causing flooding is most likely in West-central Texas and Missouri to Indiana (Fig. 8). On Wednesday, severe storms arc from the northwest Gulf States to Pennsylvania (Fig. 9) and are likely to include tornado risk.
The U.S. population weight HDD forecast continues show low heating demand (nationally) this week recovering to near normal mid-to-late March as the Northeast is exposed to some colder air (Fig. 10).
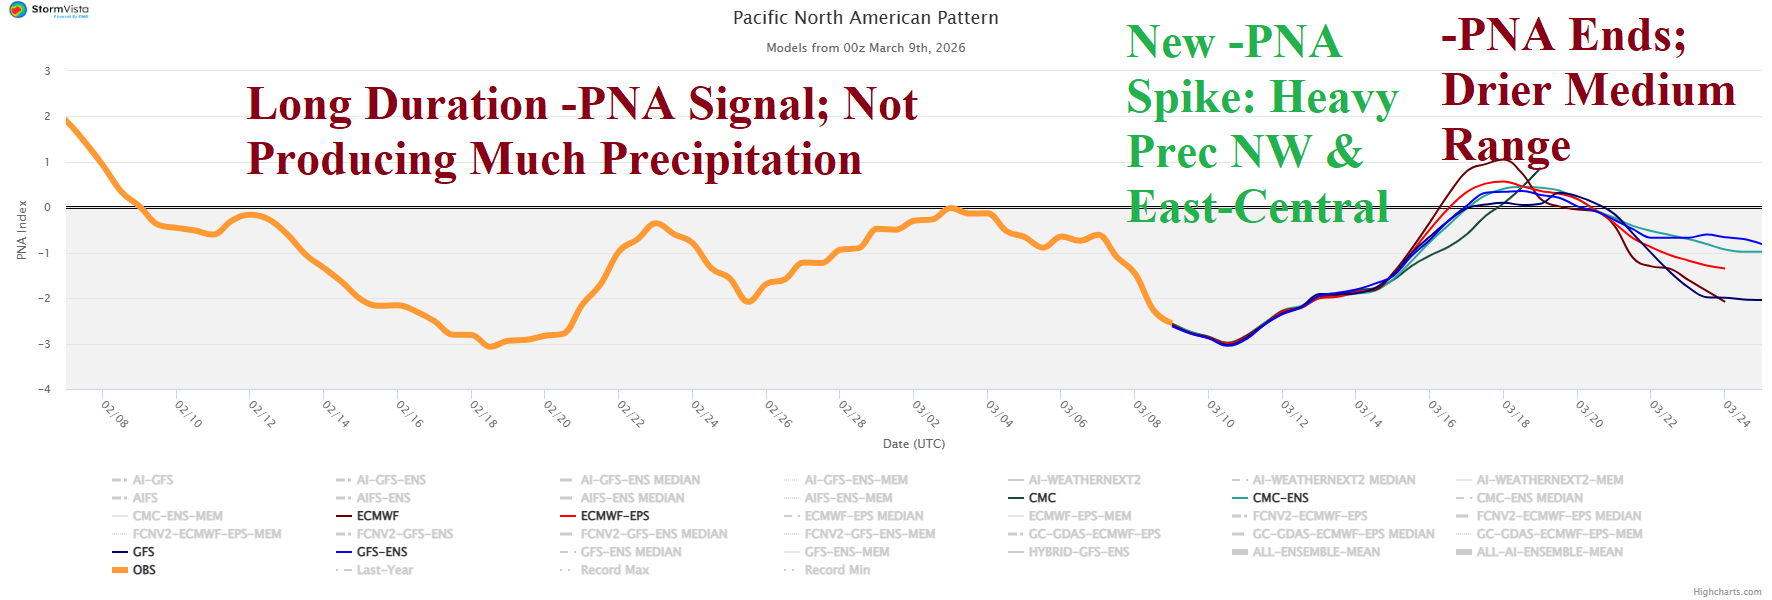
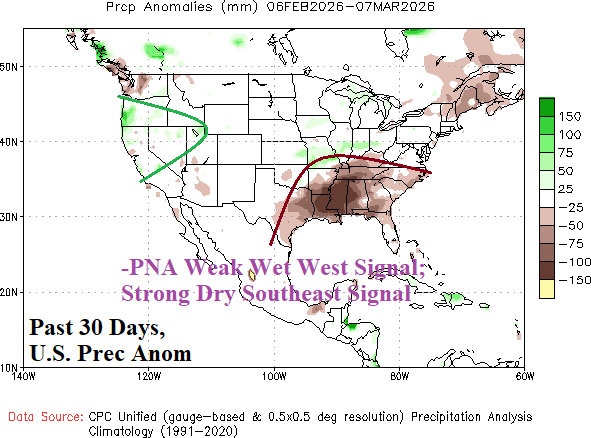
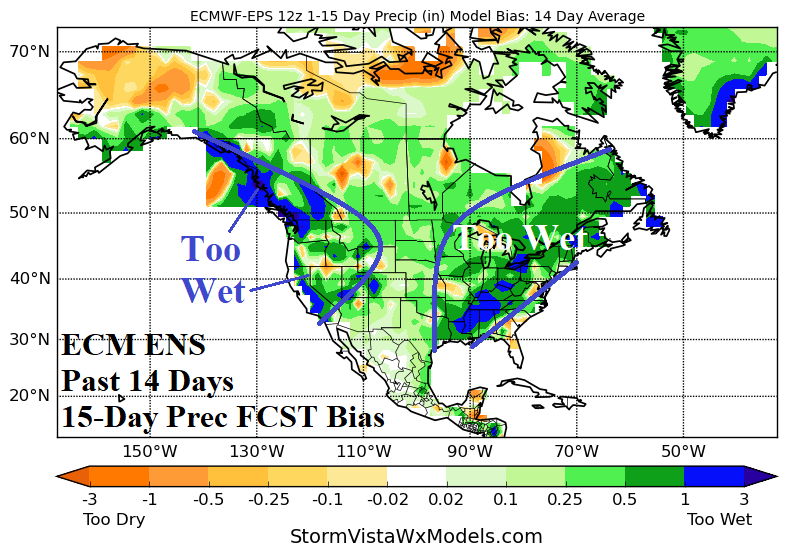
Fig. 4-6: Negative Pacific North America index is a wet Northwest/dry Southeast (U.S.) climate signal most effective in the Southeast in recent weeks. Forecast models are over-forecasting precipitation in the Northwest and East of late.
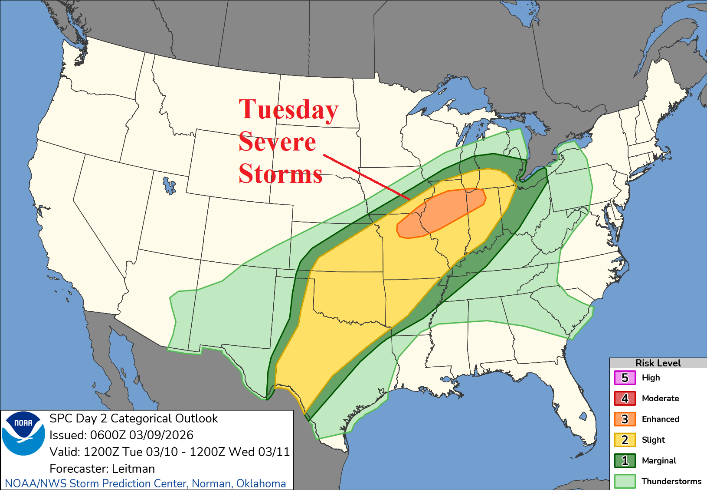
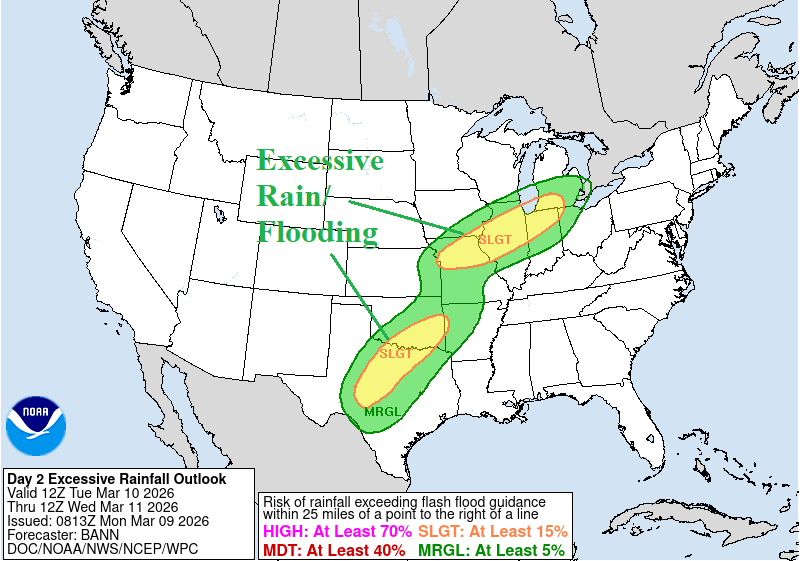
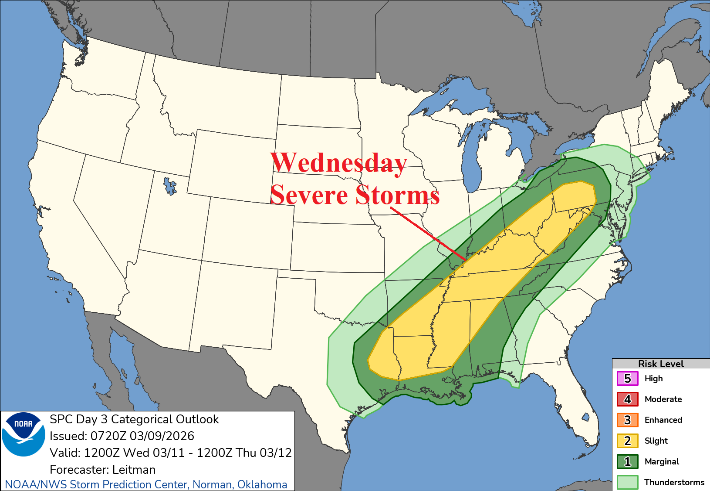
Fig. 7-9: NOAA severe weather outlook for tomorrow and attendant flooding rainfall risk areas plus Wednesday’s severe weather outlook.
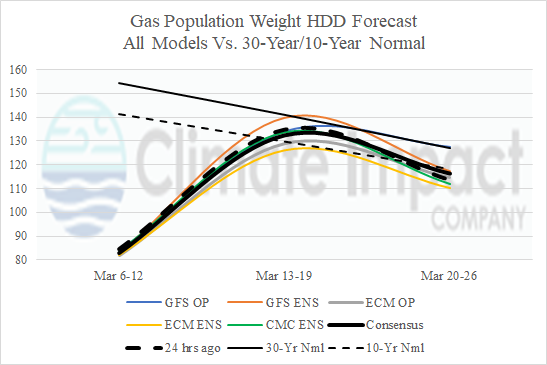
Fig. 10: The U.S. gas population weight HDD forecast utilizing all operational models, their consensus, and comparison with 24 hours ago and 30/10-year normal.