
The “Warm Blob” in the Northeast Pacific Weakens
09/28/2025, 9:36 am EDT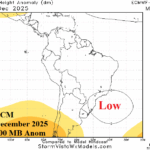
Influence on South America Climate of the Coastal Brazil Upper-level Low-pressure Area
10/06/2025, 7:11 am EDT
Climate Impact Company AI Research
Issued: Tuesday, September 30, 2025
Highlight: North and South America 16-30-day 500 MB verification

Fig. 1: 500 MB height anomaly correlation forecast skill for North America during the 16-30-day period for the last 30, 14, and 7 days.
Discussion: Surprising is overall success of the GFS ENS skill score of forecasting the upper air pattern (using 500 MB anomalies) during the 16-30-day period across both North and South America for the past 30-day, 14-day, and 7-day intervals. Traditionally, the ECM “weeklies” are used to make a “first guess” at the expected weather during this timeframe. ECM rivaled GFS ENS for North America forecasts and finished second to GFS ENS in South America. Note that leading AI models (AI 4Cast Net V2 GFS ENS, AI 4Cast Net V2 ECM ENS, and AI Graph Cast) scored “middle of the road” results and AI Graph Cast finished last with North America forecasts. The CFS V2 model, traditionally compared with ECM to generate the operational forecast, finished near last (North America) and last for South America. Overall skill scores of >0.5 (for days 16-30) are regarded reasonable while values below that level lose value quickly. Skill scores improving recently across North America are likely related to a less amplified upper air pattern while a recent stratospheric warming event across Antarctica may have caused increasing difficulty forecasting the recent South America upper air pattern causing lower skill scores.
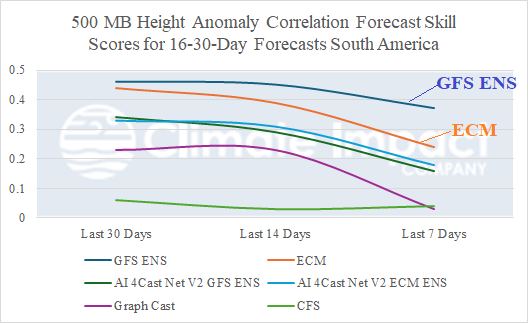
Fig. 2: 500 MB height anomaly correlation forecast skill for South America during the 16-30-day period for the last 30, 14, and 7 days.