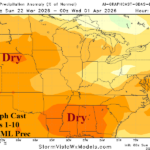
Great Plains Trending Drier/Warmer; East Europe to Persian Gulf Trend Wetter (Next 15 Days)
03/22/2026, 9:02 am EDT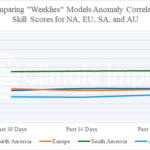
AI Research: Check On 2-Meter Temperature Forecast Skill Scores for NA, EU, SA, and AU Past 30 Days
03/24/2026, 12:27 pm EDT
U.S. Soil Moisture Observations/Forecast Report
Issued: Monday March 23, 2026
Highlight: Most likely scenario for Q2/2026 is drought expansion West into Central U.S. while eastern third of U.S. loses drought risk.
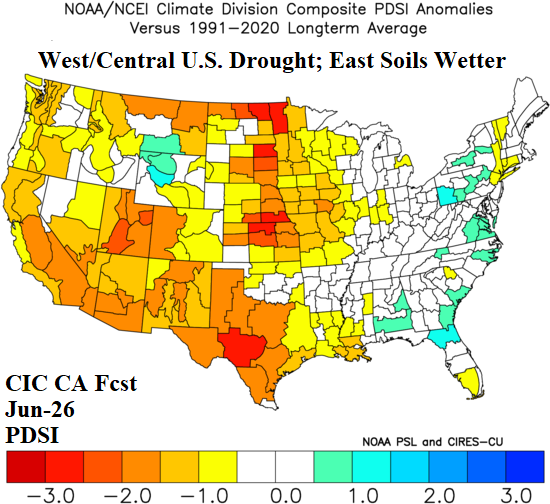
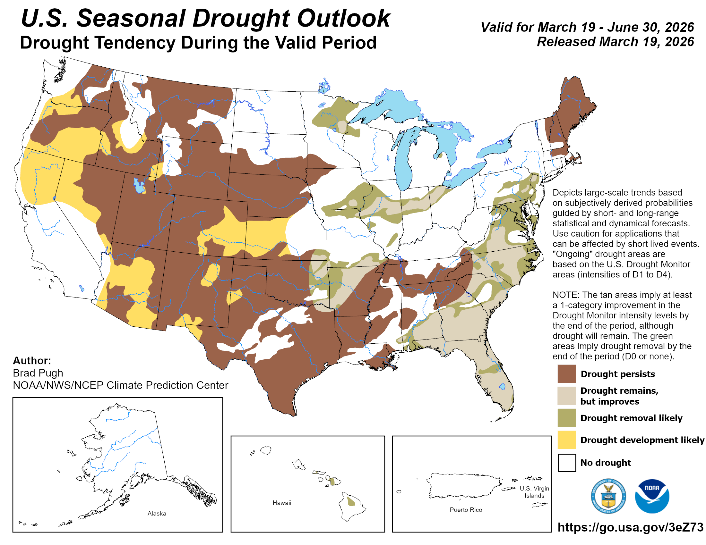
Fig. 1-2: The Climate Impact Company U.S. Palmer Drought Severity Index (PDSI) constructed analog forecast for June 2026 reveals West and Central U.S. drought risk. The NOAA/CPC seasonal outlook has similarities.
Executive summary: Although forecast models vary and consider possible improvement in U.S. soil moisture by late calendar spring, the Climate Impact Company constructed analog forecast of Palmer Drought Severity Index (PDSI) favors an expansive dry-to-drought pattern for both the West and Central U.S. (Fig. 1). Forecast confidence is near to above normal on weakening drought risk across the eastern third of the nation and strengthening drought across the West U.S. to Texas. However, forecast confidence is near to below average for the Central U.S. dry outlook. By comparison, NOAA emphasizes drought expansion for the Northwest U.S., Arizona, and Kansas (Fig. 2) while East U.S. drought weakens (except for Maine).
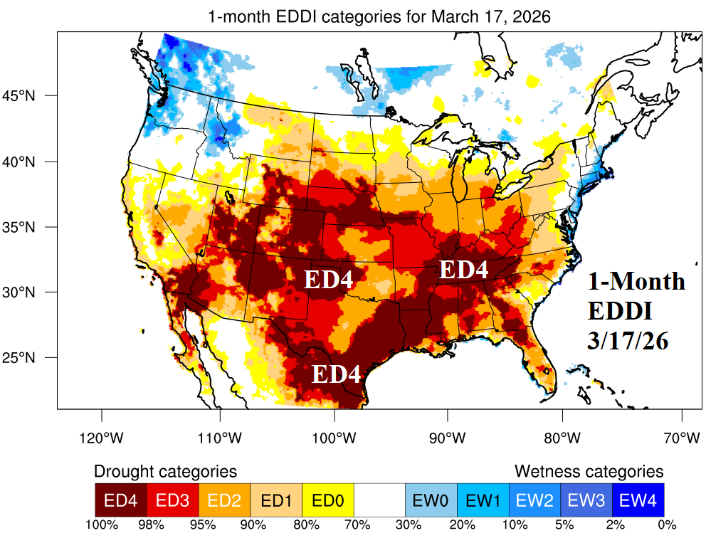
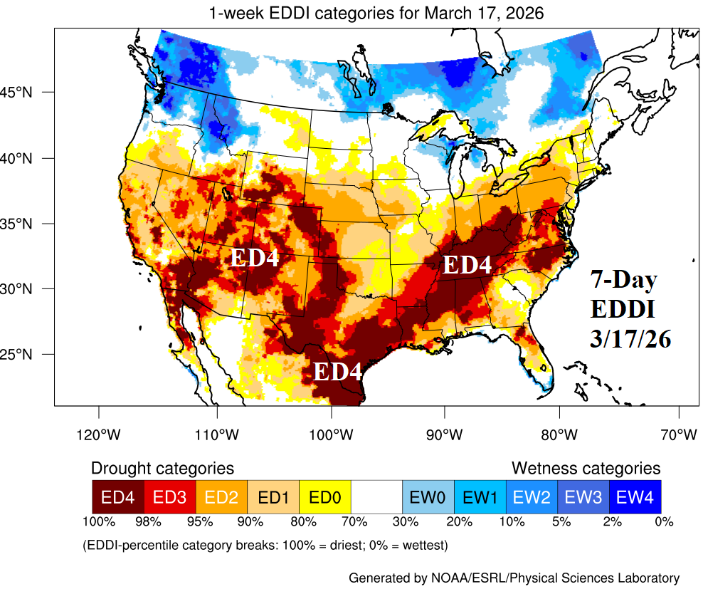
Fig. 3-4: The 30-day and 7-day evaporative drought demand index analysis for March 17, 2026.
Discussion: The Great Basin, Southwest U.S., and eastward across Texas to the northwest Gulf States have observed the warmest Q1 on record. As meteorological spring arrives, Extreme Heat and Red Flag Warnings are becoming more frequent and widespread in this region. The evaporative drought demand index (EDDI) indicates where attendant drought is most likely to travel given early springtime rainfall patterns. The 30-day EDDI analysis reveals much of the southern 70% of the U.S. in danger of strengthening ongoing drought or developing drought (Fig. 3). Recent rainfall has caused the aggressive EDDI analysis to ease off on central Great Plains harsh dryness while ED4 continues Texas to the Tennessee Valley and recently emerges in the Carolinas (Fig. 4). Of course, the Great Basin and Southwest U.S. remain in an adverse drought condition. Historically, dry soil conditions are severe in the Great Basin to Texas and throughout the Mid-south States plus much of the Southeast States and Atlantic Seaboard (Fig. 5). In March, wetter weather has erased dry soil threat in the Great Lakes region with a notable wetter trend in the U.S. Corn Belt plus the northern Mid-Atlantic States and Far Northwest States (Fig. 6). The 10-day outlook is drier and much warmer than normal across much of the current dry-to-drought-concern area indicating a worsening condition expected (Fig. 7). Glancing at the CFS V2 sensible forecast and identifying the trend for U.S. precipitation in April and May (Fig. 8-9) suggests wet weather across the Canadian Prairies to the Upper Midwest U.S and Ohio Valley to Mid-Atlantic region during April with patchy rain across much of the Great Plains in May. The CFS V2 shifts a dry forecast across Texas and vicinity in April to wetter than normal during May. A possible explanation for the wetter Central/East-central U.S. forecasts by CFS V2 is the tendency for upper-level high-pressure ridging across and poleward of a large marine heat wave off the North America West Coast (Fig. 10) while recent sharp cooling of the Gulf of Mexico surface supports a downstream upper-level low-pressure trough pattern (Fig. 11). Forecast projections for June (early meteorological summer) vary. The SPI6 soil moisture projection for June 2026 reveals dryness intensifies in the Southeast States while the Texas drought eases and West/North-central U.S. drought persists and strengthens (Fig. 12). The NCEP CAS soil moisture anomaly forecast is agreeable to Southeast U.S. drought and maintains Texas drought while the central Great plains shift into drought (Fig. 13). The Southwest drought eases while California drought emerges. The preferred forecast given precipitation forecast trend is the constructed analog from Climate Impact Company which stresses drought expansion for the West and Central U.S. while drought risk lowers and disappears for much of the East (Fig. 14).
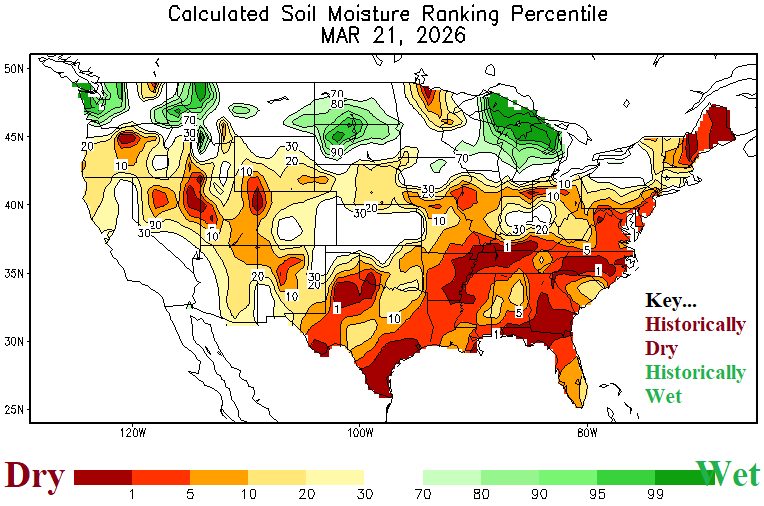
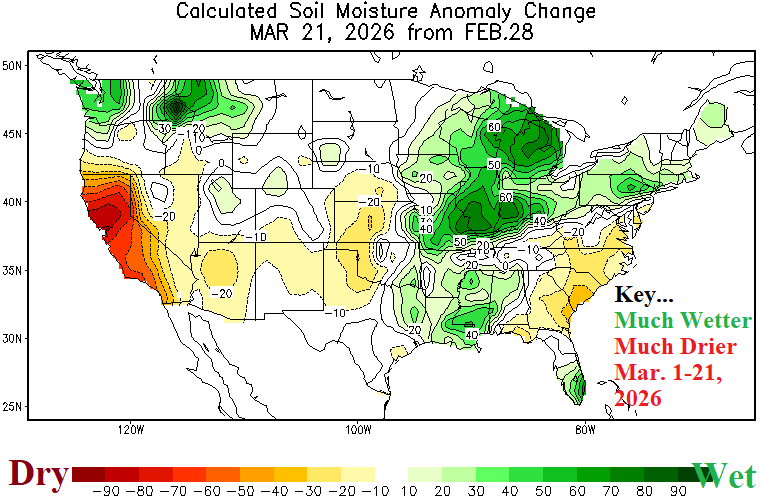
Fig. 5-6: Daily U.S. soil moisture rankings and the March (so far) change.
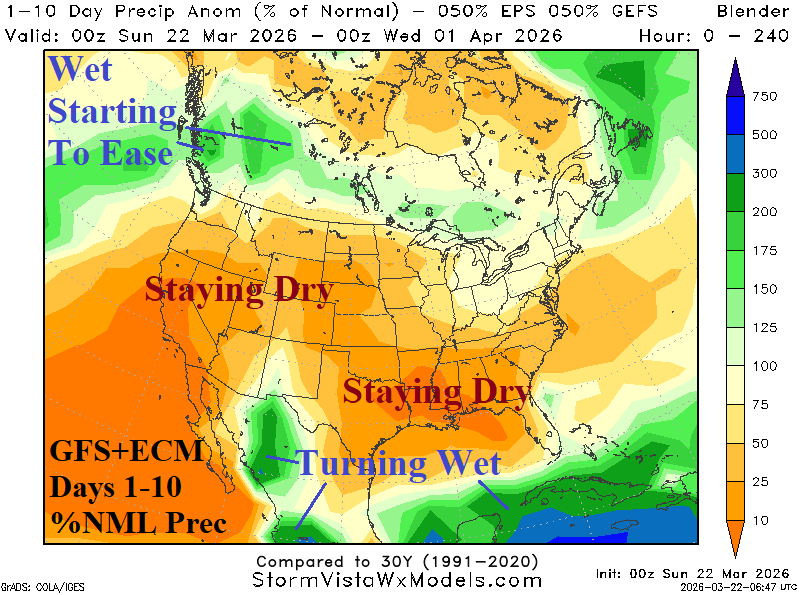
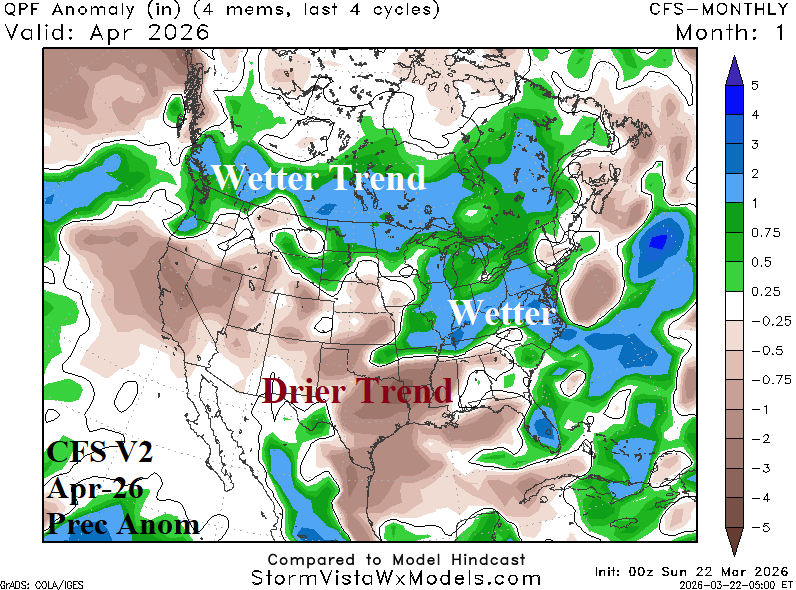
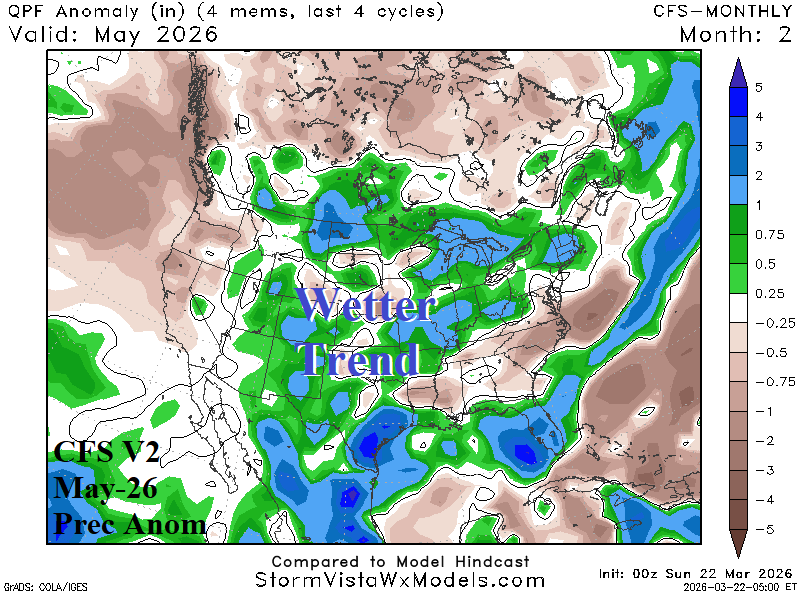
Fig. 7-9: The GFS+ECM 10-day percent of normal rainfall forecast across the U.S. plus CFS V2 rainfall anomaly climate outlooks for April and May 2026.
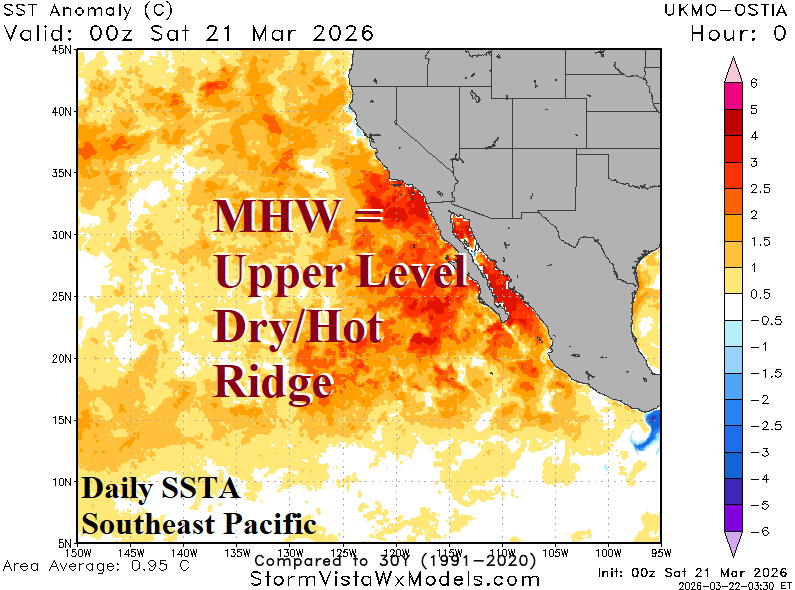
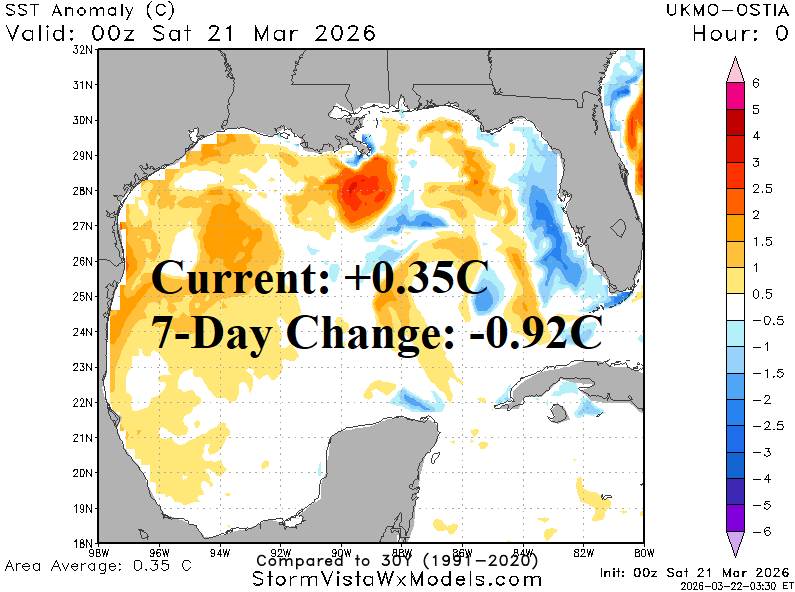
Fig. 10-11: High pressure aloft is likely across and poleward of a marine heatwave off the North America West Coast while the sharp cooling of the Gulf of Mexico during the past week suggests an upper trough may develop north of this region.
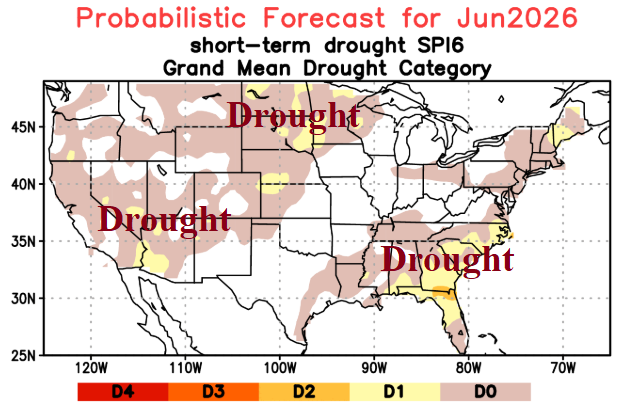
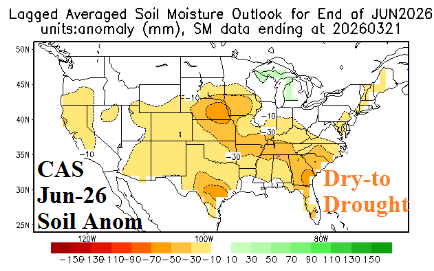

Fig. 12-14: The SPI6 and CAS U.S. soil moisture anomaly forecasts for June 2026 plus the Climate Impact Company constructed analog forecast of Palmer Drought Severity Index valid for June 2026.