Wet/Cool Spring Followed by Evolving Summer Heat/Dryness East Australia
08/22/2025, 5:20 am EDT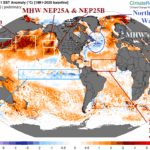
The Northern Hemisphere Upper Air Pattern Changes in September
08/28/2025, 9:48 am EDT
Climate Impact Company Tropical Feature
Issued: Monday August 25, 2025
Highlight: Regional SSTA across the North Atlantic basin. 2025 is significantly cooler thanks to Erin.
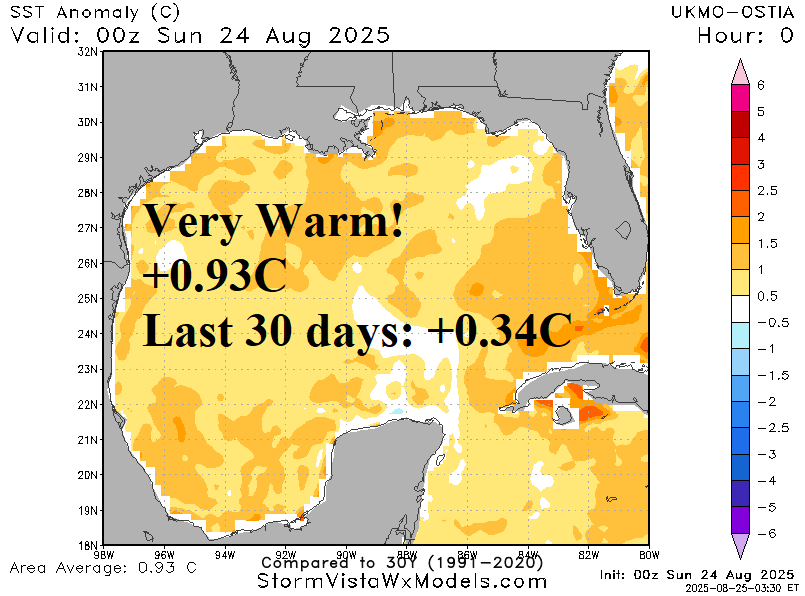
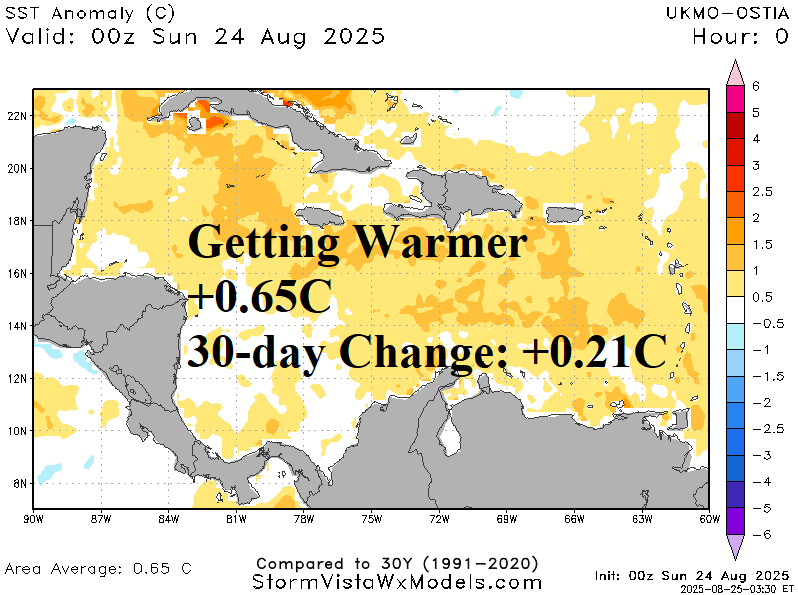
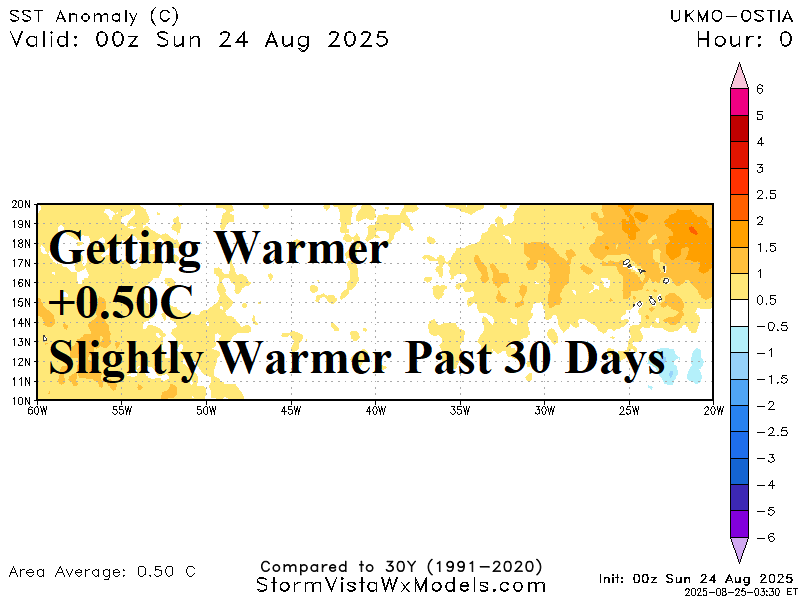
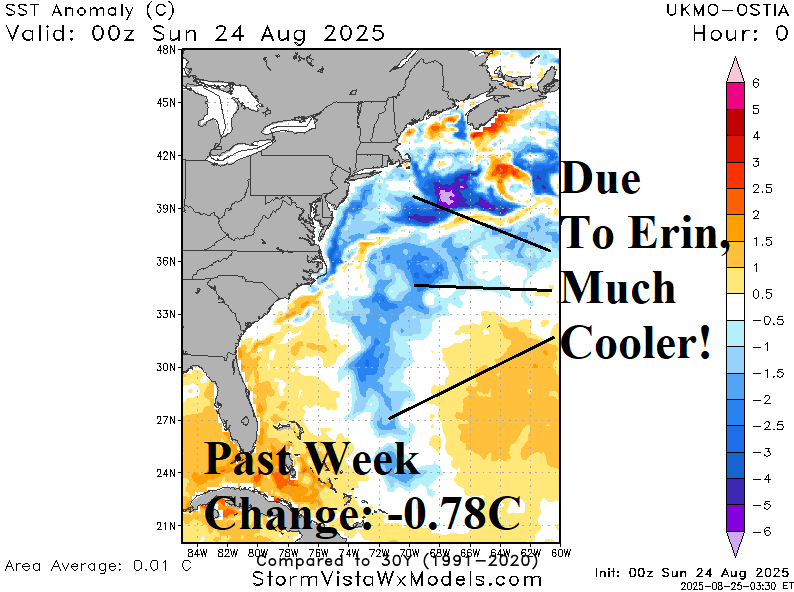
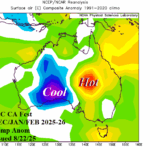
Fig. 1-4: Regional SSTA regimes across parts of the North Atlantic basin.
Discussion: The lack of tropical cyclone activity across the Gulf of Mexico and Caribbean Sea is allowing each basin to shift warmer. The Gulf of Mexico is nearly 1C warmer than normal and warmer by 1/3C during the past 30 days (Fig. 1). The Caribbean Sea has warmed by 2/10C during the past 30 days to 0.65C (Fig. 2). The central to outer tropical North Atlantic basin across the main development region (MDR) for hurricanes has warmed slightly to +0.50C (Fig. 3). One area cooling significantly is the western North Atlantic basin where Erin up-welled cool water causing the western basin to cool to normal (Fig. 4). The North Atlantic basin is marginally warm at +0.34C and much cooler than 1 year ago by 0.52C (Fig. 5-6).
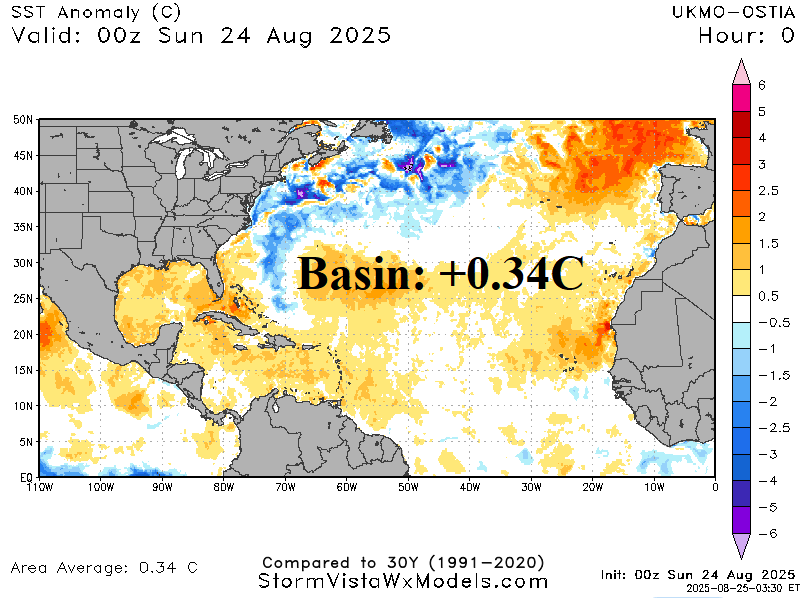
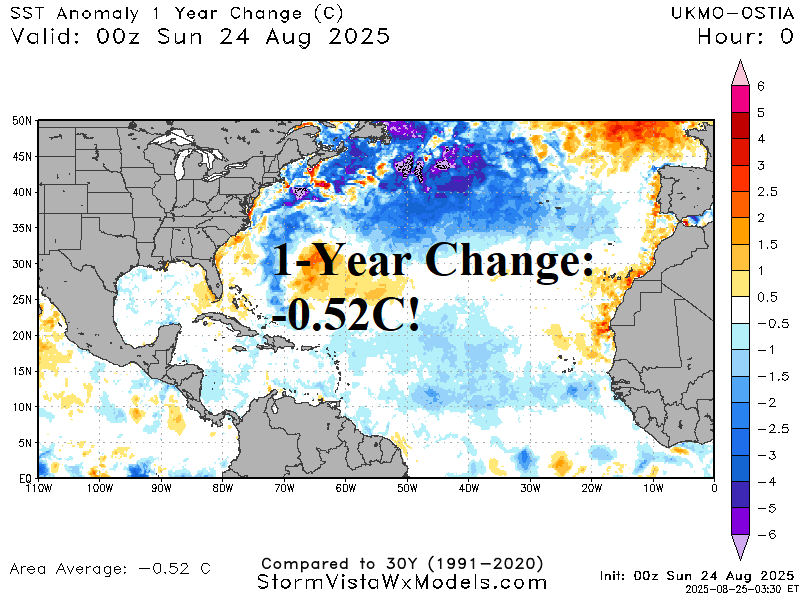
Fig. 5-6: The North Atlantic basin temperature and 1-year change.