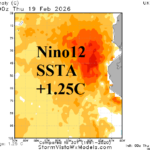
The Warming Nino12 SSTA Region Helps to Inspire Heavy Rain Ahead in Brazil
02/20/2026, 9:05 am EST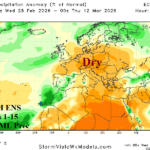
Positive Scandinavia Index Supports Warmer/Drier Europe Climate, But Will it Last?
02/25/2026, 8:10 am EST
![]()
Climate Impact Company Monday Holiday Report
Global Weather/Climate Report
Issued: Sunday February 22, 2026
Highlight: Current U.S. soil moisture, El Nino, and potential JUN-SEP rainfall pattern; Brazil rains and New South Wales (new) heat and dryness.
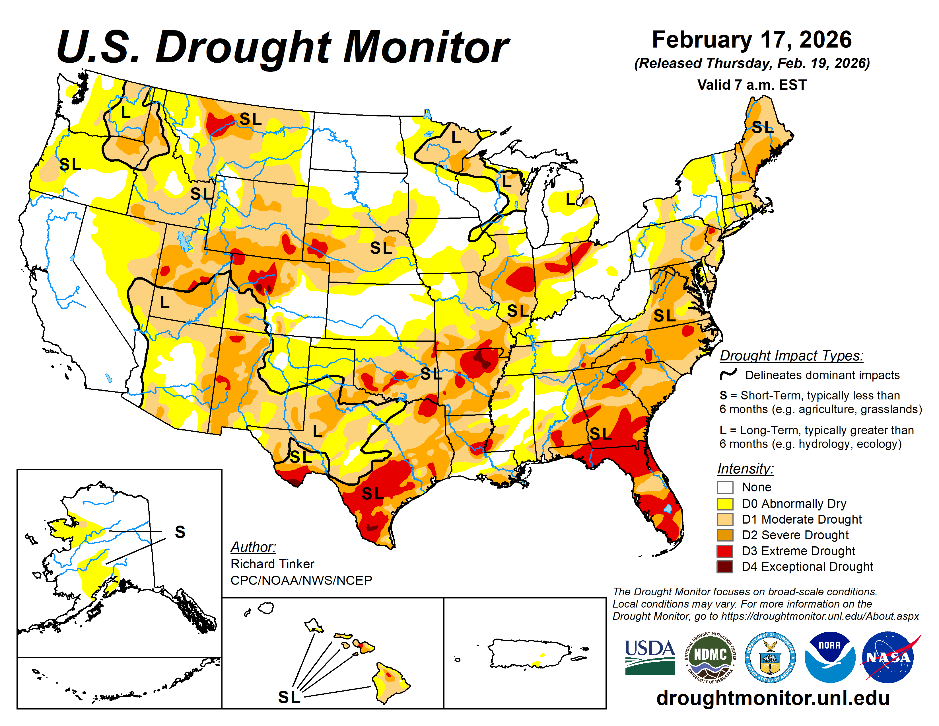
Fig. 1: The U.S. Drought Monitor valid February 17, 2026.
Discussion: As of mid-February, 73.7% of the U.S. is in a dry-to-drought condition up from 66.2% in mid-December according to NOAA (Fig. 1). Harsh D2-D4 drought is observed in 22.6% of the U.S., an increase of almost 10% during the past 2 months. The hardest hit agriculture areas are Illinois, Indiana, Missouri, Nebraska, and Oklahoma where each state has presence of D3 extreme drought. States with the worst drought conditions are Texas and Florida, characteristic of a La Nina climate. Somewhat surprising, given the La Nina climate, is the widespread drought across the Interior Northwest U.S.
The subsurface equatorial East Pacific continues to warm dramatically (Fig. 2). AG Markets are generally aware of impending ENSO phase change mid-to-late 2026 to El Nino which implies a change in areas affected by drought while some areas with drought receive beneficial rain. A preliminary analog on the potential U.S. precipitation change is based on the presence of La Nina followed by a change to El Nino during the middle third of the year. The only analog years taken from the past 3 decades with the described qualifiers are 1997 and 2023. The consensus of each analog year implies worsening drought risk in Iowa and the Gulf States while the wet bias develops and expands across the West U.S. reaching parts of the western Great Plains during the JUL-SEP warm season (Fig. 3). NCEP SPI6 and CAS soil moisture outlooks for May favor drought risk for much of the Great Plains eastward to the Atlantic Coast (Fig. 4-5). El Nino-related influence on precipitation regimes is strongest during the cold season.
Weather satellite reveals copious heavy rain developing across Brazil at midday confirming the excessive amount forecast via the 12Z GFS (Fig. 6). The 6-10-day forecast pushes the heavy rain into Northeast Brazil leaving Southeast Brazil drier (Fig. 7). Thunderstorm streaks appear in Central Argentina next weekend. In the 11-15-day period, the trend is wetter in Argentina (Fig. 8).
In Australia, the wet 10-day forecast for central/south-central continent remains although a new twist develops as northern New South Wales shifts hot and dry much of the next 2 weeks (Fig. 9-10).
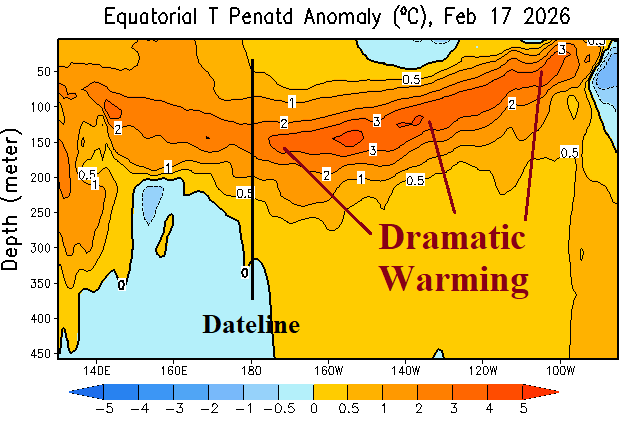
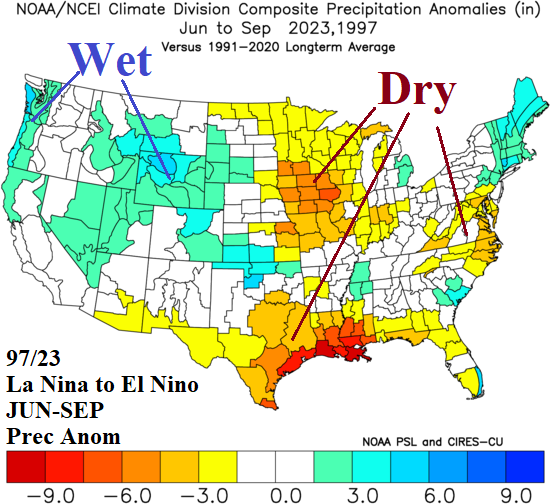
Fig. 2-3: The eastern equatorial Pacific Ocean is warming dramatically signaling El Nino risk ahead. Analog years with a La Nina to El Nino (by mid-year) transition precipitation tendency for JUN-SEP is indicated.
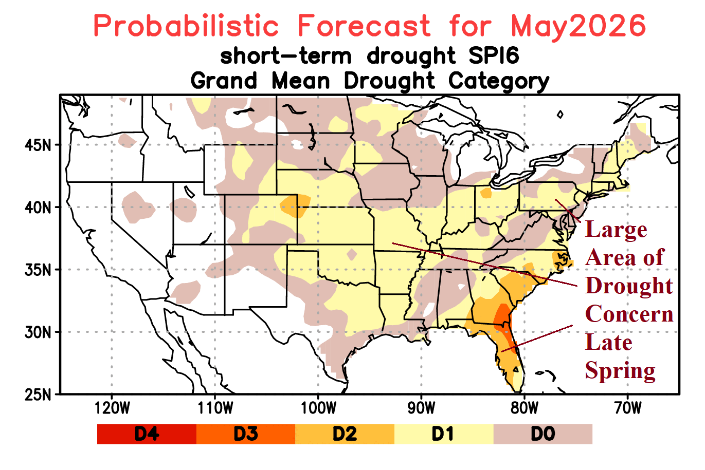
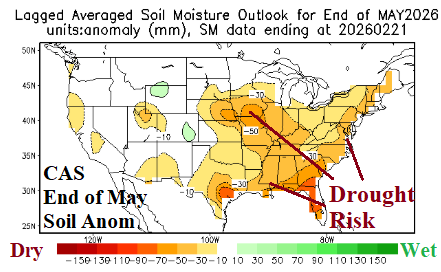
Fig. 4-5: The probabilistic (NOAA/SPI6) soil moisture forecast for May 2026 and the NCEP CAS soil moisture analog projection for the same time.
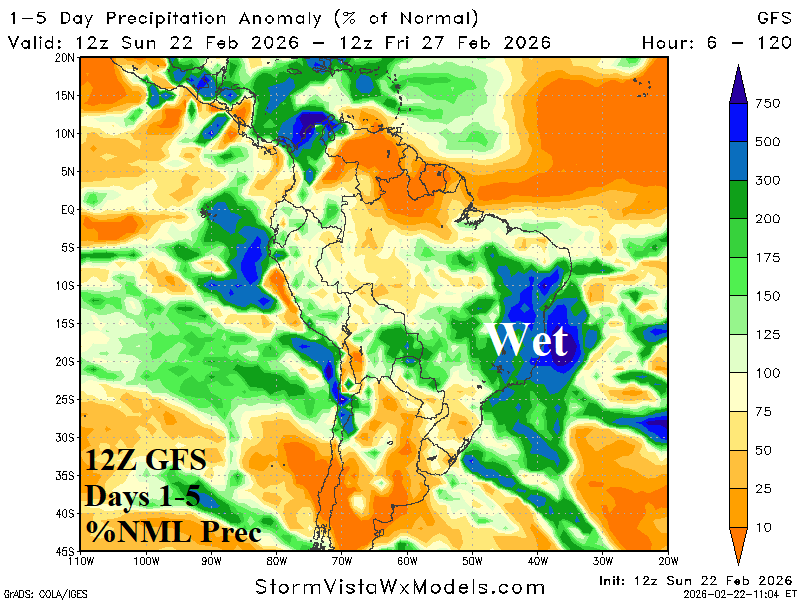
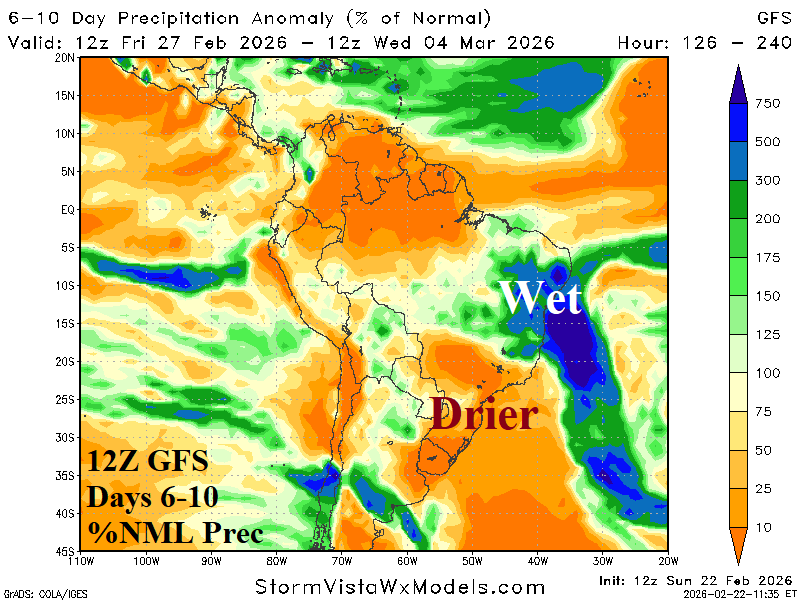
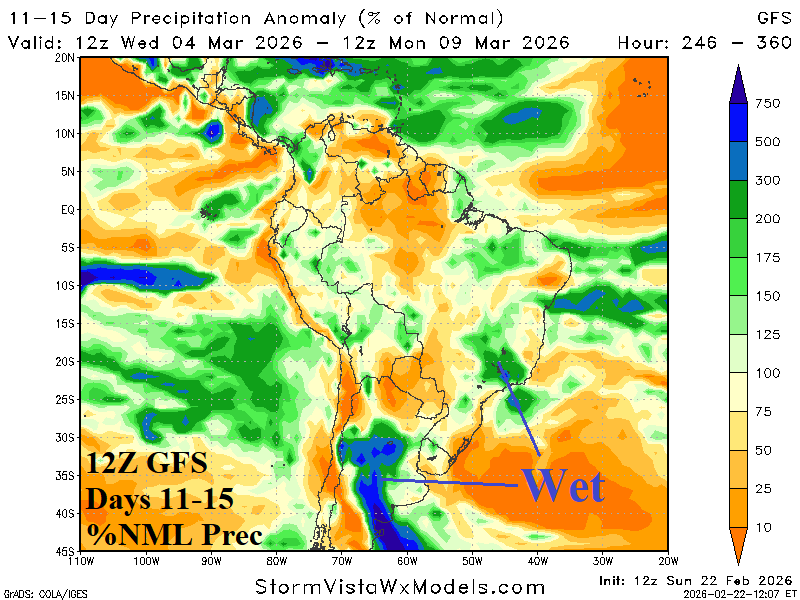
Fig. 6-8: The 12Z GFS percent of normal 15-day rainfall forecast for South America.
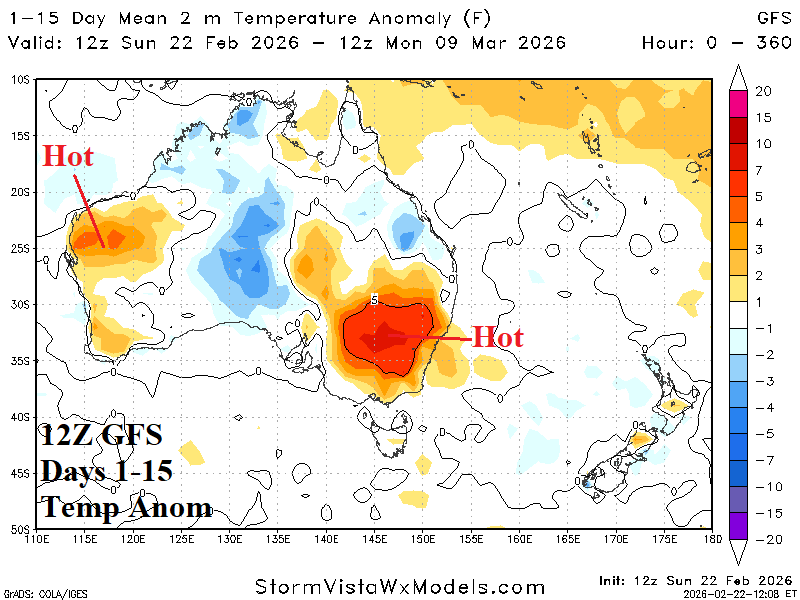
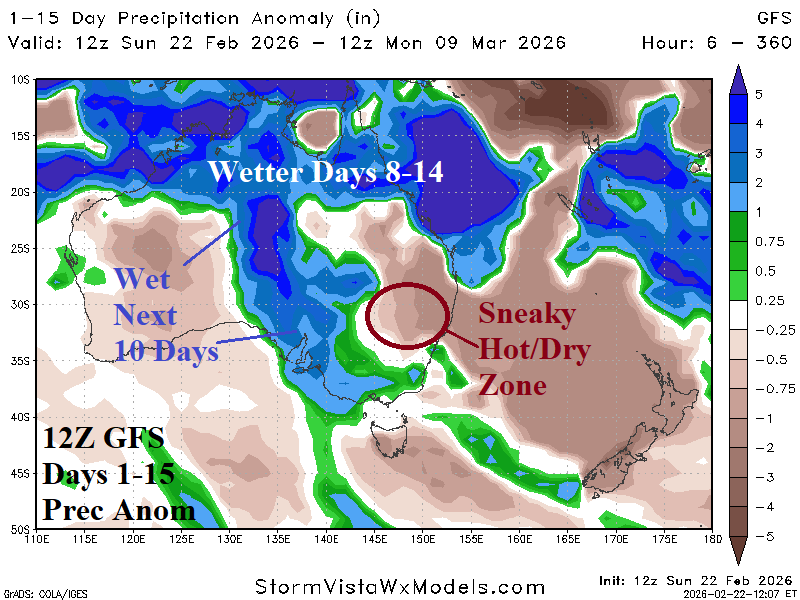
Fig. 9-10: The 12Z GFS 15-day temperature and precipitation anomaly forecast across Australia.