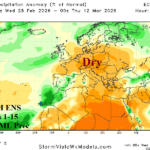
Positive Scandinavia Index Supports Warmer/Drier Europe Climate, But Will it Last?
02/25/2026, 8:10 am EST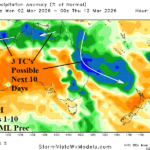
Heavy Rain Continues in Australia; Queensland Primary Target. Possible 3 Tropical Cyclones This Week!
03/02/2026, 1:35 pm EST
Climate Impact Company Early U.S. Notes
Issued: Thursday February 26, 2026
Highlight: New concern…Evolving (MJO-inspired) heavy rain/severe weather pattern South-central U.S. beginning middle of next week.
Climate signals discussion: Significant increase in the positive phase of both the arctic oscillation and East Pacific oscillation are indicated during the 6-10-day forecast each supporting a very warm U.S. forecast. The strong positive phase arctic oscillation is maintained in the 11-15-day forecast while ongoing negative Pacific North America index strengthens signaling steady warmth Central and East and cooler West.
ENSO/MJO: Waters off the northwest coast of South America warmed vigorously during February although slightly cooler this week. Other Nino SSTA are in neutral range. The equatorial East Pacific subsurface is extremely warm. The MJO 15-day forecast indicates eastward progression with moderate strength through phase_5/phase_6 (equatorial West Pacific to the Dateline) supportive of U.S. warmth and potential significant Central/East-central U.S. storms.
Operational discussion: Wet weather moves across the Southeast U.S. and Florida the next 2-3 days. The next storm system may bring moderate snows from Omaha to near St. Louis to Morgantown and northward on Sunday reaching the northern Mid-Atlantic States on Monday (Fig. 1). By mid-next week, heavy rain and possible severe weather will develop across Texas to Missouri (Fig. 2). Once the Texas to Missouri rainfall is established middle of next week, MJO influence maintains the heavy rain pattern throughout the 8-14-day period (Fig. 3). Included with that rainfall are additional severe storms. U.S. gas population weight HDD forecasts through the first third of March continue to surge much warmer.
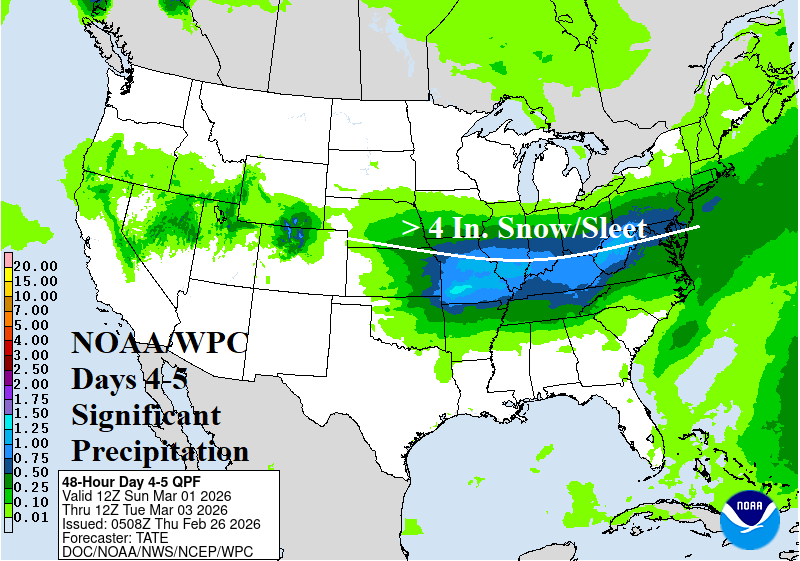
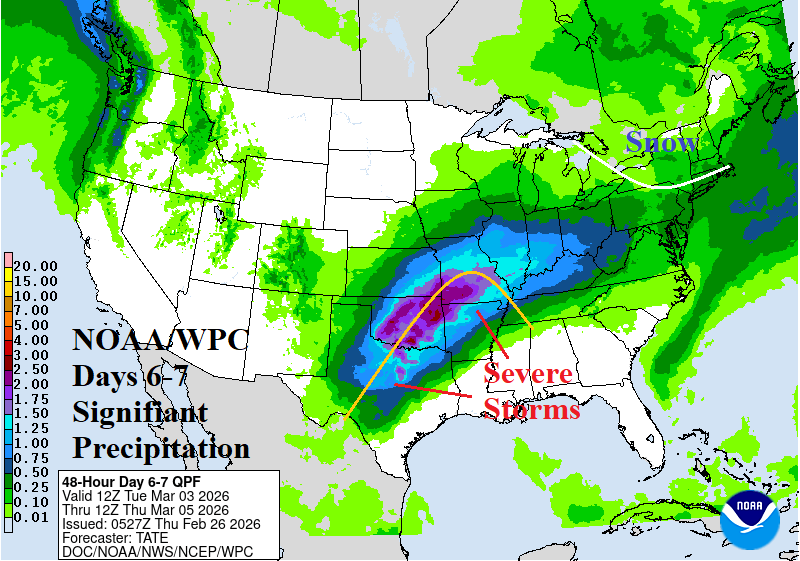

Fig. 1-3: NOAA/WPC 4-5-day and 6-7-day quantitative precipitation forecast and the GFS+ECM 8-14-day precipitation amount projection.
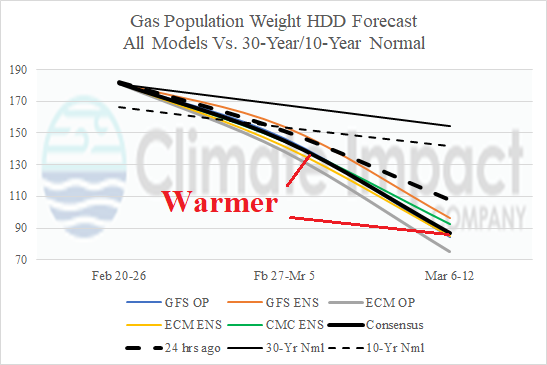
Fig. 4: The U.S. gas population weight HDD forecast utilizing all operational models, their consensus, and comparison with 24 hours ago and 30/10-year normal.