West/South Europe Heavy Rains Ahead
01/22/2026, 11:58 am EST
Active East Pacific MJO + -AO/-NAO = Atlantic Coast Weekend Snowstorm
01/26/2026, 3:59 pm EST
![]()
Climate Impact Company Sunday Report
Global Weather/Climate Report
Issued: Sunday January 25, 2026
Highlight: Drier Brazil this week, some wet weather next week. ECM and AI agree on wet Brazil 16-30-day period.

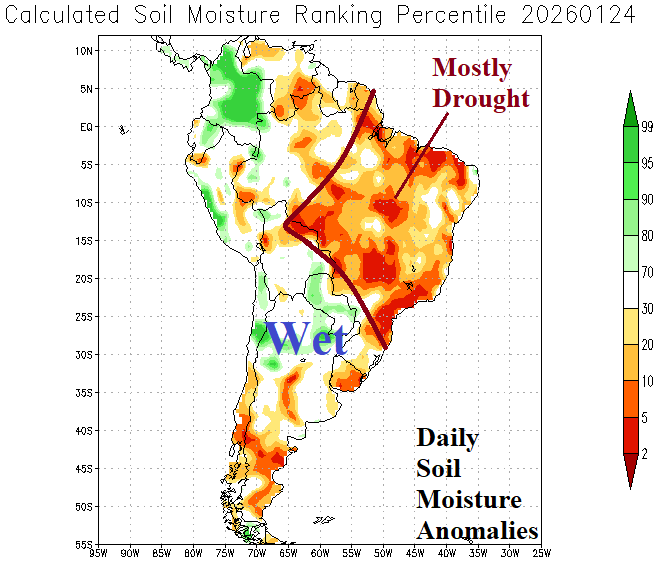
Fig. 1-2: Percent normal rainfall during the past 7 days across South America and the daily soil moisture anomalies analysis.
Discussion: During the past week, South America rainfall was robust across Northern Chile, Northwest Argentina, and Eastern Brazil (Fig. 1). Dryness was dominant across Central Argentina to Southwest Brazil and along the North Coast of South America. Soil moisture conditions remain unchanged with dry-to-drought conditions dominating Brazil and a wet bias for Northern Argentina (Fig. 2). The AI Graph Cast is utilized to project the rainfall pattern during the next 2 weeks. This week, mostly dry conditions are indicated for East/Northeast Argentina and much of Brazil (Fig. 3). Brazil shifts drier this week despite a favorable Madden Julian oscillation (MJO) for a wetter pattern. Wet weather develops in Central/South Argentina plus Southern Brazil next week (Fig. 4). Interestingly, both ECM and AI Graph Cast are agreeable on a 16-30-day outlook favoring wet weather in Central and Southeast Brazil while Argentina shifts hotter (Fig. 5-6).
A major snowstorm struck the U.S. over the weekend. Prohibitive snow cover is indicated by GFS by dawn tomorrow except for The Central Pains where the ground is bare while encountering arctic cold (Fig. 7). In 15 days, snow cover is forecast to retreat (Fig. 8).
In Europe, a recent trend toward drier soil conditions has developed from France to Poland (Fig. 9). There is potential for several tropical cyclones in Australia to New Zealand waters through the next 15 days (Fig. 10). Extremely hot weather remains forecast for Southeast/East Australia this week edging northward in the 6-10-day period.


Fig. 3-4: The AI Graph Cast 1-7-day and 8-14-day percent of normal rainfall forecast across South America.
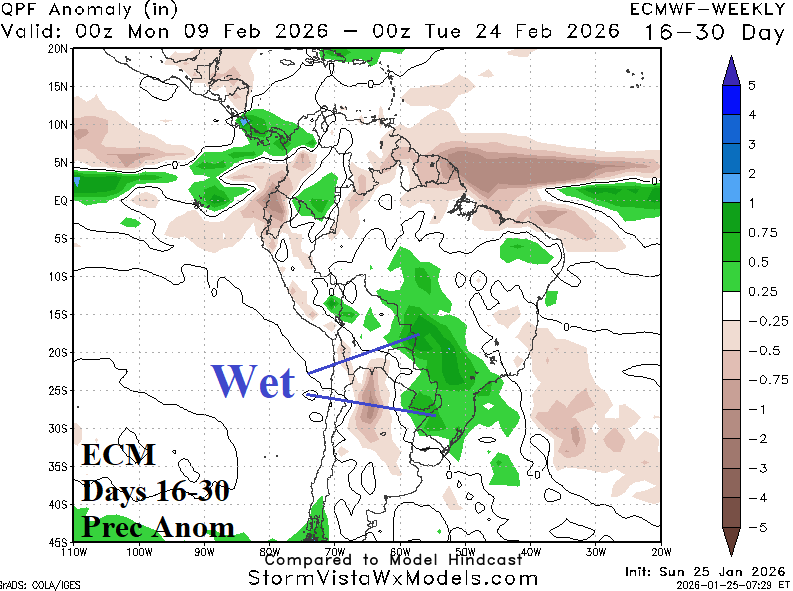
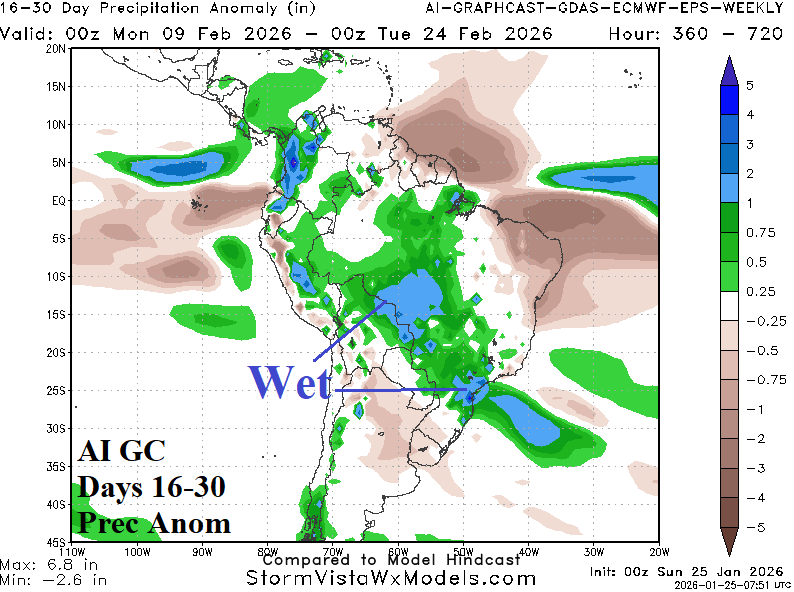
Fig. 5-6: The ECM and AI Graph Cast rainfall anomaly outlook for the 16-30-day period.
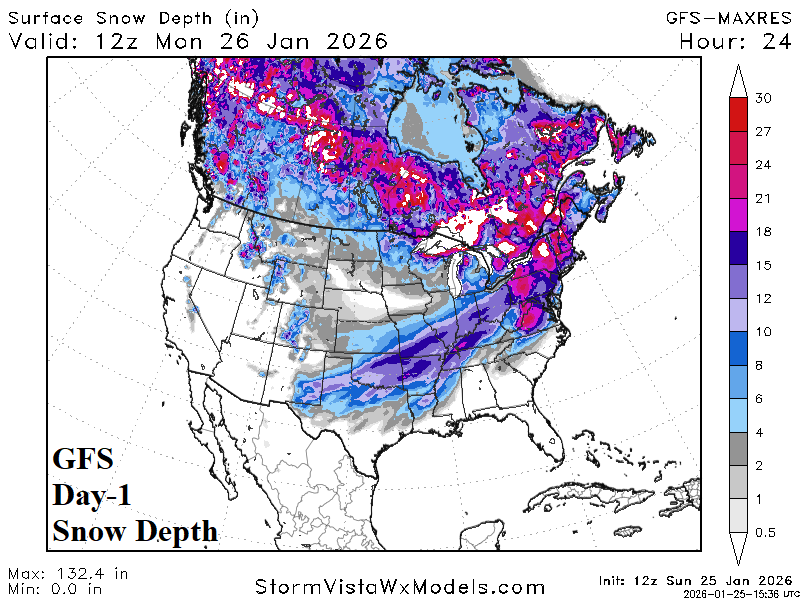
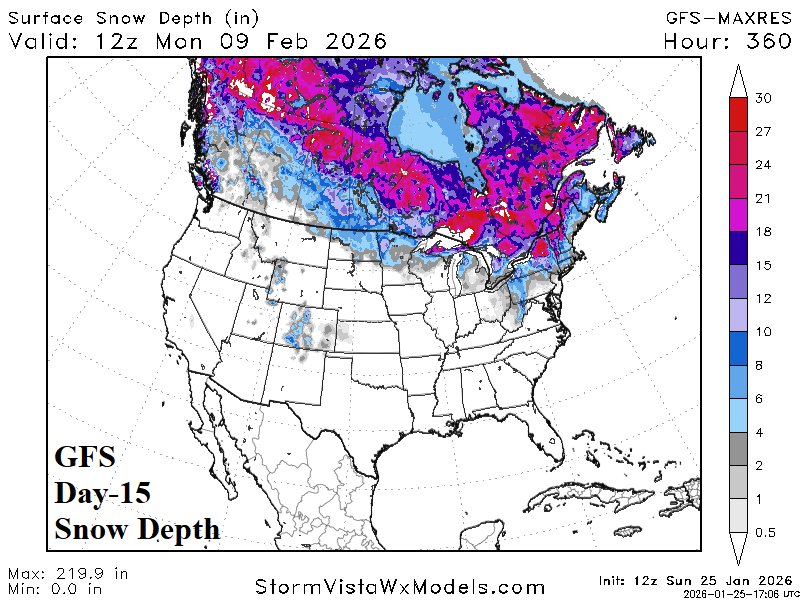
Fig. 7-8: The GFS snow depth projection for tomorrow morning and 15 days from now.
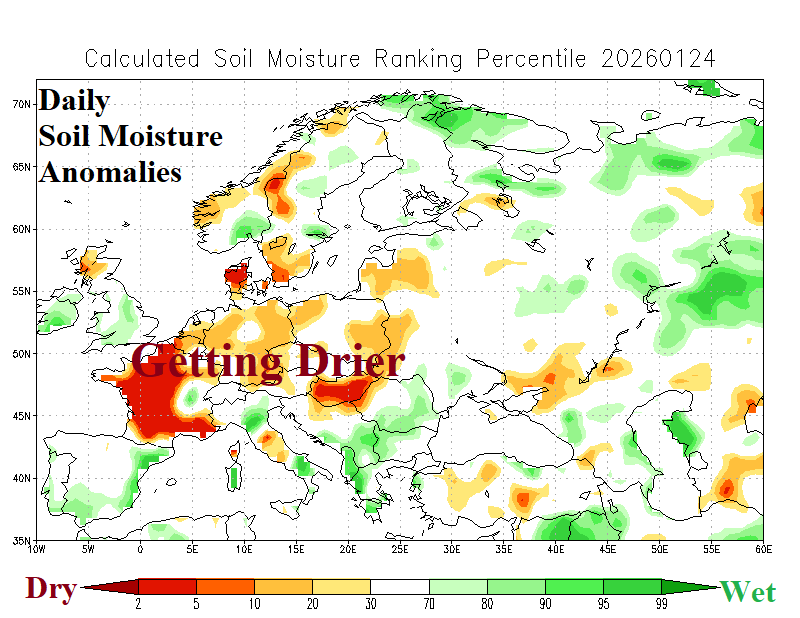
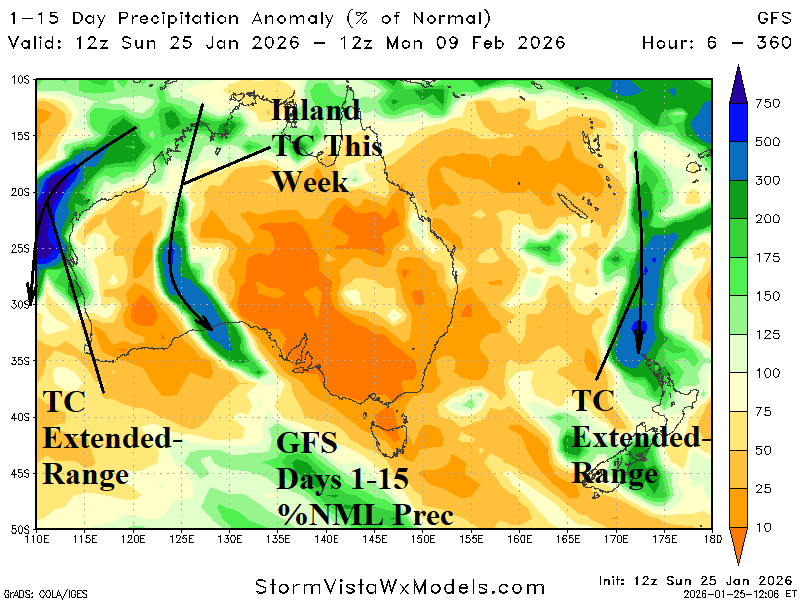
Fig. 9-10: The Europe daily soil moisture anomalies analysis and 15-day percent of normal rainfall outlook for Australia according to the latest GFS.