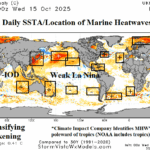
October 2025 Marine Heatwave Outlook
10/16/2025, 8:19 am EDT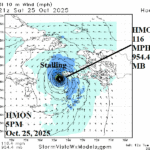
Will Melissa Be an RI Candidate?
10/21/2025, 4:38 pm EDT
Climate Impact Company Weekly ENSO Climate Diagnostics
Issued: Monday October 20, 2025
Highlight: Can I use southern oscillation index to approximate multivariate ENSO index?
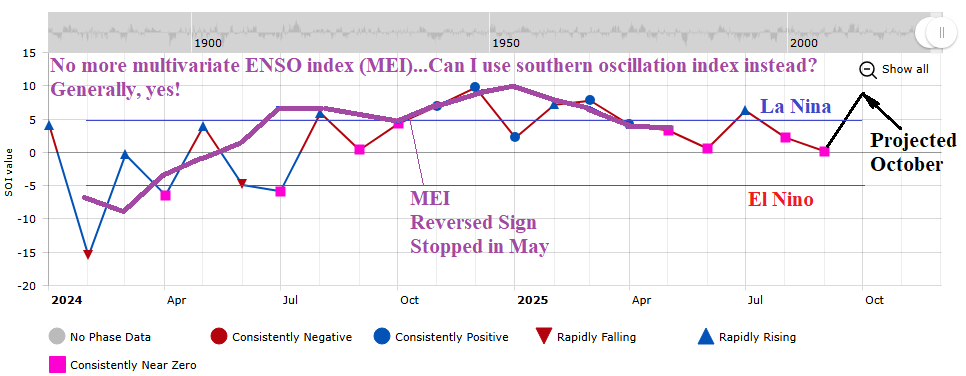
Fig. 1: Recent multivariate ENSO index (reversed sign) generally runs parallel to southern oscillation index.
Discussion: NOAA’s multivariate ENSO index (MEI) changed its data input from the Japanese Meteorological Agency’s JRA-55 reanalysis dataset to JRA-3Q as of January 2024. However, the data has not been attainable since May although NOAA claims the data is available (although hard to decipher with the government shutdown). MEI is a handy climate diagnostic identifying the atmospheric reaction to the SSTA/SLPA pattern across the Pacific tropics/subtropics. At-a-glance, the southern oscillation index (SOI) which measures the atmospheric reaction to SSTA/SLPA in the equatorial region is generally agreeable to MEI. Since JAN-24 and through MAY-25, MEI generally ran parallel to the monthly (Long Paddock) SOI (Fig. 1).
Regarding the current ENSO, the SOI is positive which promotes a La Nina climate. The Nino34 SSTA has ran close to the La Nina threshold since September shifting within the La Nina threshold last week (Fig. 2). Other Nino SSTA regions remain neutral.
In the subsurface, cooler than normal waters required to up-well to the surface due to trade winds is marginally cool and less cool than a few weeks ago (Fig. 3).
Overall, a very weak La Nina is present and potential for strengthening is low.
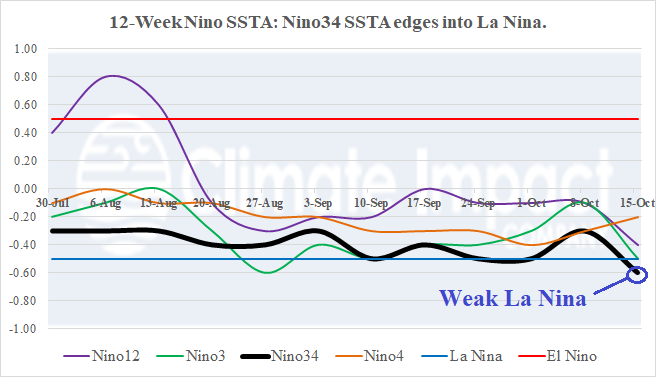
Fig. 2: The 12-week monitor of the Nino SSTA regions indicates the Nino34 SSTA has cooled within the La Nina threshold.
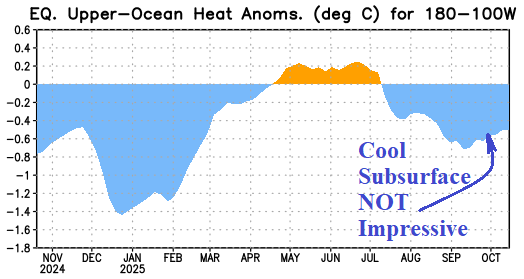
Fig. 3: The monthly upper ocean heat anomalies across the equatorial Pacific Ocean for the past 12 months.