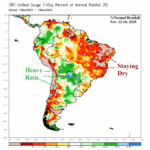
Central South America Rains Forecast to Shift Into Brazil
11/20/2025, 8:54 am EST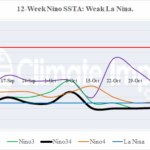
Weak La Nina Continues
11/25/2025, 5:42 am EST
Climate Impact Company Gas/Power Report
Issued: Monday November 24, 2025
Headline: U.S. Cold Season Population Weight & Selected Cities HDD Forecast Update (all data on CIC website).
Discussion: The NOV-25 projected U.S. gas population weight HDD is 487 which is much warmer than the 30-year (589) and 10-year (560) normal. Despite late month cold, the first 3 weeks of the month were prohibitively warm (except New York/New England). The NOV-25 projection is 7th warmest of this century.
DEC-25 is cold North and warm southern half of the U.S. There are questions on how much cold can affect high heating demand areas such as PJM and NEPOOL. Right now, NEPOOL is at greatest risk of cold. Snow cover governs the DEC-25 pattern. South of snow cover, the month averages warmer than normal. The projected U.S. gas population weight HDD for DEC-25 is 848 which is in-between the 30-year normal (884) and 10-year normal (817). The DEC-25 projection is tied for 13th coldest of this century.
A slightly colder revision, from 924 to 930 U.S. gas population weight HDD is indicated for JAN-26 which is warmer than both the 30-year normal (991) and 10-year normal (955). The SSTA-based forecast is mild across much of the U.S. during mid-winter. However, there is an above normal risk of stratospheric warming leading to arctic air and the Northern U.S. should maintain snow cover consequently colder risk compared to the forecast is evident. Without the cold risk factors, the month is mild and ranks 11th warmest this century.
Arctic air is present during FEB-26. However, greatest impacts are across West and Central U.S. most acute over snow cover. The East is warm with arctic air arrival moderated and short-lived. The U.S. gas population weight HDD forecast for FEB-26 has increased slightly to 797 which is in-between the 30-year normal (818) and 10-year normal (786) and ranks 12th coldest this century. The character of the FEB-26 cold is low risk across the high demand areas such as NEPOOL, PJM-East, and SERC although brief cold is likely in ERCOT.
Calendar winter finishes temperate as MAR-26 U.S. population weight HDD is 621 which is in between the 30-year normal (649) and 10-year normal (606). The MAR-26 forecast is unchanged and ranks 10th warmest this century.
City forecasts for DEC/JAN/FEB 2025-26 rank from the coldest Seattle (103.6% of the 30-year normal), Minneapolis (102.3%), and Portland, OR (101.7%) to the warmest Houston (83.6%), Charleston, SC (84.6%), and Atlanta (88.6%). Nationally, the U.S. selected cities HDD forecast for DEC/JAN/FEB 2025-26 is 95.6% of the 30-year normal compared to 99% last winter. The NOV-25 through MAR-26 HDD forecast is 94.2% of the 30-year normal compared to 93.7% last year.
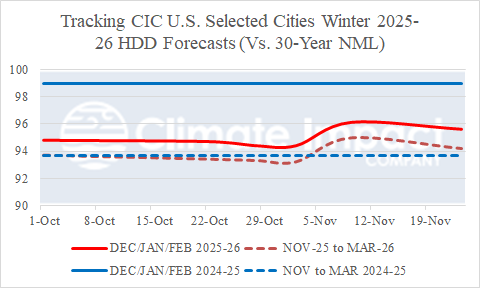
Fig. 1: Tracking the U.S. selected cities HDD forecasts for the cold season compared to last year.
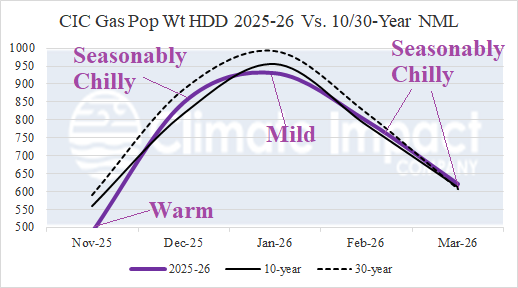
Fig. 2: The U.S. gas population weight HDD forecast for the 2025-26 cold season compared to the 30-year/10-year normal.
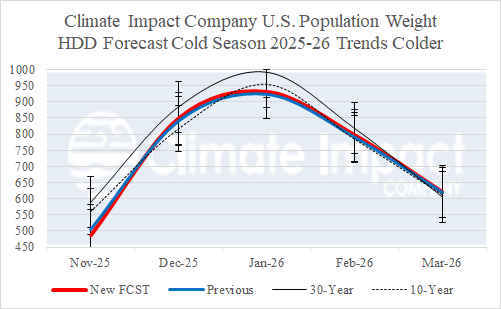
Fig. 3: The U.S. gas population weight HDD forecast for the 2025-26 cold season forecast compared to the previous outlook issued last week.
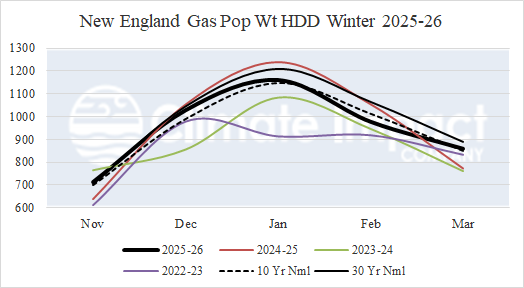
Fig. 4: The New York/New England 2025-26 cold season gas population weight HDD forecast compared to the last 3 winter seasons and 30-year/10-year normal.
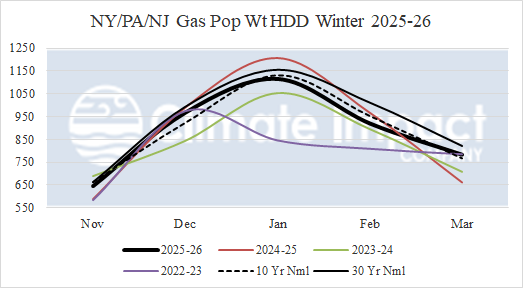
Fig. 5: The Northern Mid-Atlantic U.S. 2025-26 cold season gas population weight HDD forecast compared to the last 3 winter seasons and 30-year/10-year normal.
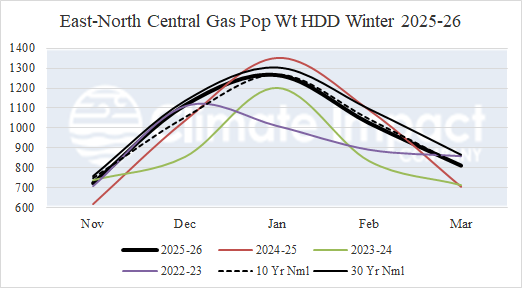
Fig. 6: The Midwest/East-North Central U.S. 2025-26 cold season gas population weight HDD forecast compared to the last 3 winter seasons and 30-year/10-year normal.
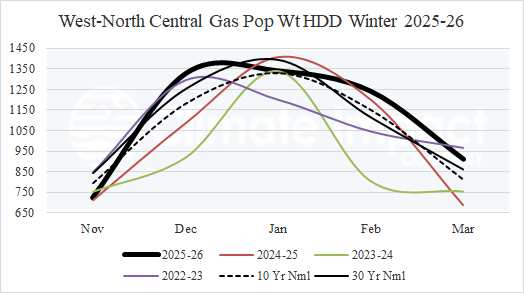
Fig. 7: The West-North Central U.S. 2025-26 cold season gas population weight HDD forecast compared to the last 3 winter seasons and 30-year/10-year normal.
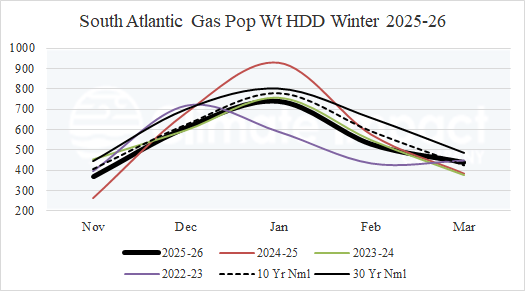
Fig. 8: The Southeast U.S. 2025-26 cold season gas population weight HDD forecast compared to the last 3 winter seasons and 30-year/10-year normal.
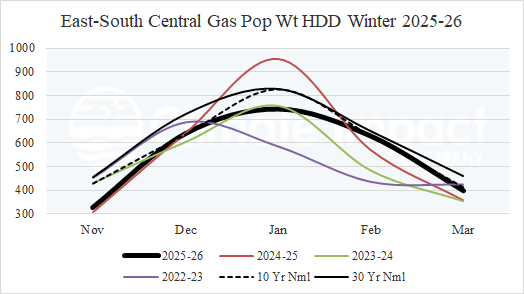
Fig. 9: The Mid-south U.S. 2025-26 cold season gas population weight HDD forecast compared to the last 3 winter seasons and 30-year/10-year normal.
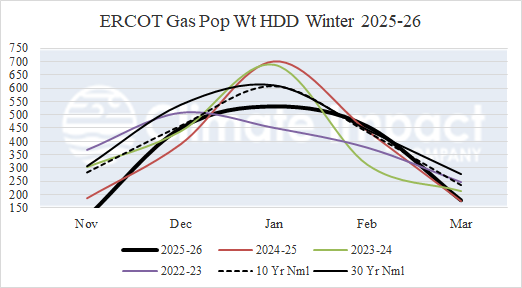
Fig. 10: The Texas Area 2025-26 cold season gas population weight HDD forecast compared to the last 3 winter seasons and 30-year/10-year normal.
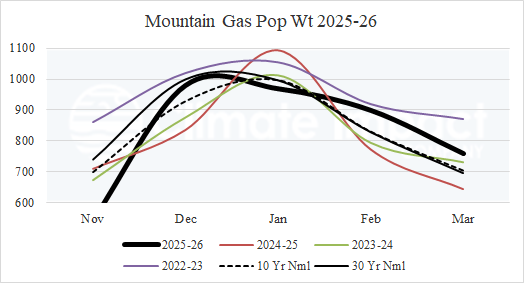
Fig. 11: The Mountainous West U.S. 2025-26 cold season gas population weight HDD forecast compared to the last 3 winter seasons and 30-year/10-year normal.
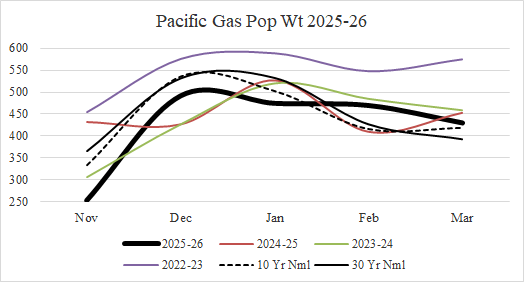
Fig. 12: The Pacific West Coast 2025-26 cold season gas population weight HDD forecast compared to the last 3 winter seasons and 30-year/10-year normal.