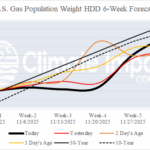
Current Short-term and Winter U.S. (and Europe) HDD Projections
10/29/2025, 6:01 am EDT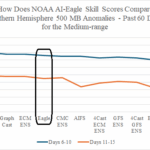
NOAA To Make Adjustments to AI Eagle Model
11/05/2025, 7:25 am EST
Climate Impact Company Early AG Market ALERT
Issued: Monday November 3, 2025
Highlight: Explaining the unexpected October 2025 heat and dryness across Australia.
Discussion: The OCT-25 Indian Ocean dipole (IOD) was in the -1.4C range, the strongest monthly -IOD in the 1950-2025 period of record (POR). The daily index was -1.7C on 30-OCT and is -1.6 today. According to Australia Bureau of Meteorology (ABOM), -IOD usually produces a wetter than normal climate across much of the southern half of Australia (Fig. 1). Meanwhile, the OCT-25 Nino34 SSTA was near -0.55C and NOAA announced La Nina onset in early October. The daily Nino34 SSTA has cooled to -0.6C. The ABOM La Nina climate schematic indicates a wet bias to eastern continent during La Nina (Fig. 2). The wet -IOD/La Nina bias cooling the climate pattern failed during OCT-25. Eastern Australia was unexpectedly very dry (Fig. 3) and the mid-spring thermal pattern across Australia was unusually hot featuring record-strength heat across parts of Southern Queensland, Northern New South Wales, and parts of the interior continent where OCT-25 temperature anomalies were +3C to +6C (Fig. 4). During OCT-25, presence of a strong negative phase Antarctic oscillation (-AAO) over-ruled the wet climate bias normally provided by -IOD and La Nina. The attendant blocking high pressure over Antarctica forced the polar vortex toward the middle latitudes splitting into several centers, one southeast of Australia (Fig. 5). Compensating for the trough was a dry/hot subtropical ridge extending westward across Eastern Australia causing the dryness and far-reaching anomalous heat. The -AAO pattern fades during the first half of November (Fig. 6). Consequently, with -IOD and La Nina having increasing influence on Australia climate, the continental pattern shifts wetter and much cooler (Fig. 7-8).
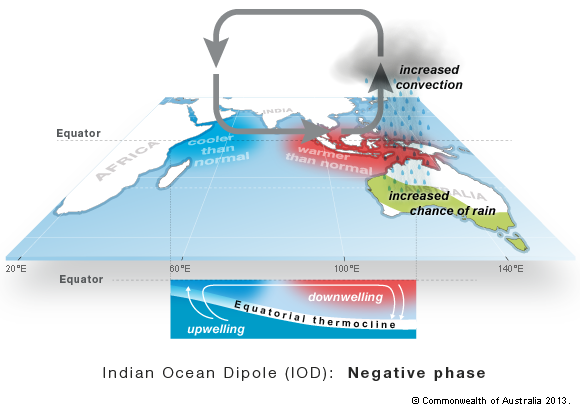
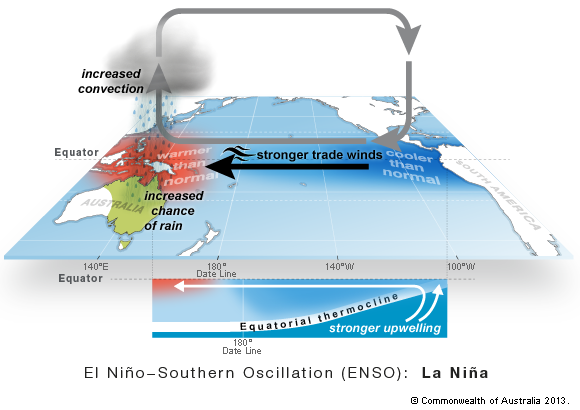
Fig. 1-2: Australia Bureau of Meteorology climate schematics for Australia during negative phase Indian Ocean dipole and La Nina.
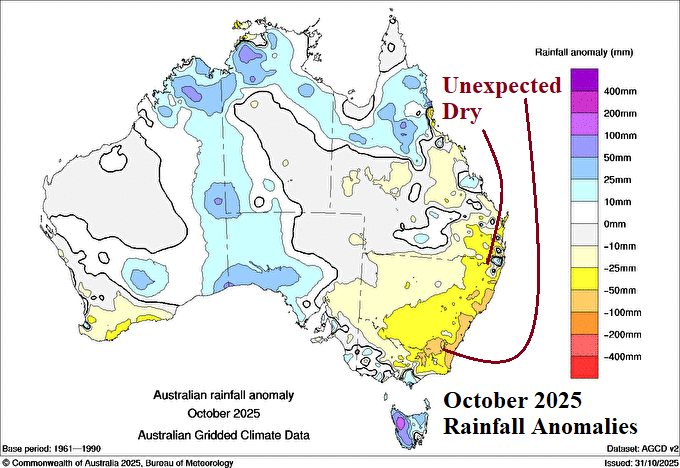
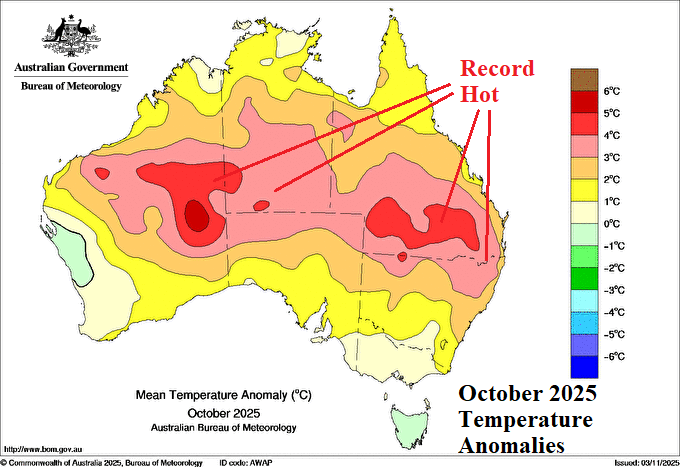
Fig. 3-4: The October 2025 rainfall and temperature anomalies across Australia.
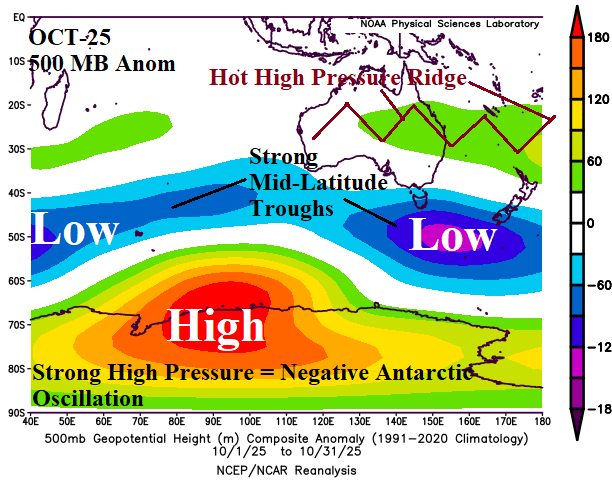
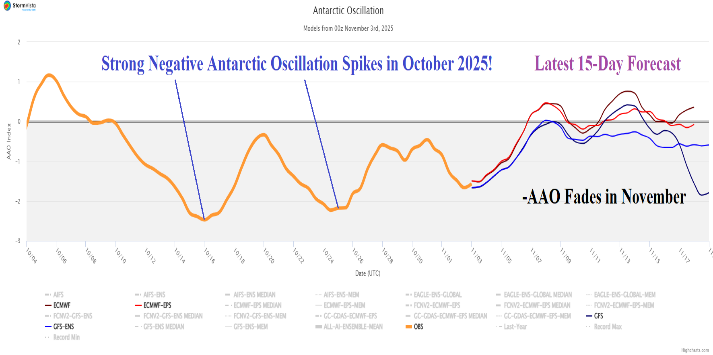
Fig. 5-6: The October 2025 500 MB anomaly analysis from Antarctica to Australia and the 30-day observations/15-day forecast of the Antarctic oscillation.
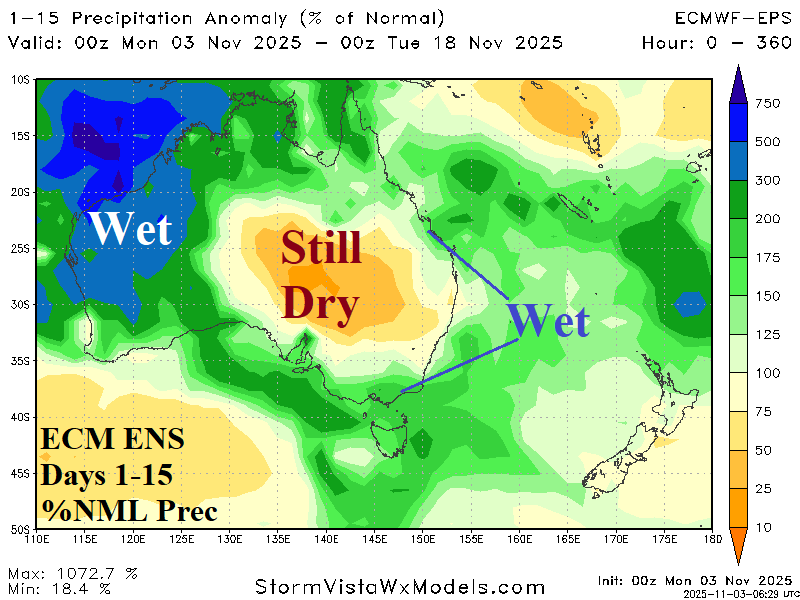
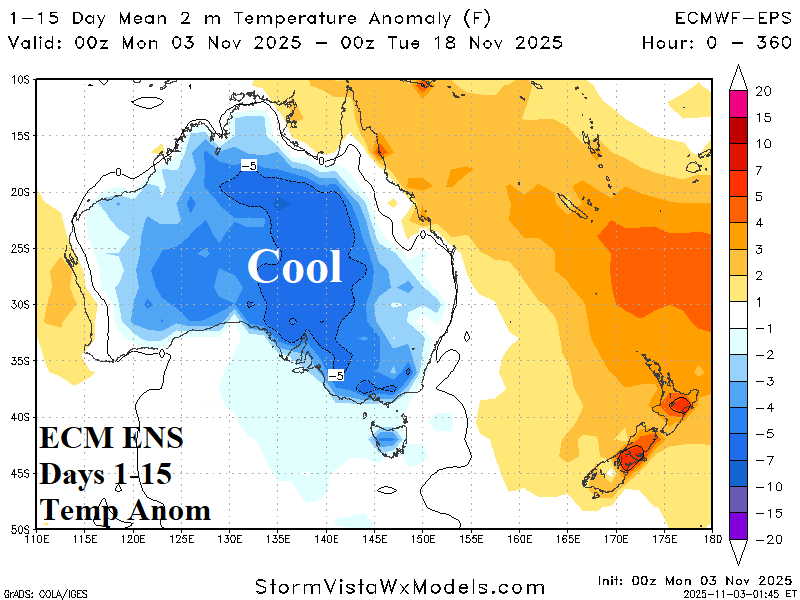
Fig. 7-8: ECM ENS 15-day percent of normal rainfall and temperature anomalies across Australia.