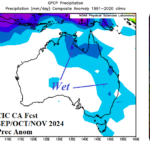
With La Nina and Potential -IOD Ahead Australia Returns to Wet Climate Pattern
06/16/2024, 9:08 am EDT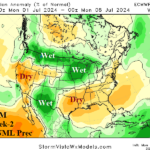
Midwest Heavy Rains Continue into Early July; Expansive Heat and Dryness Follows
06/24/2024, 4:52 pm EDT
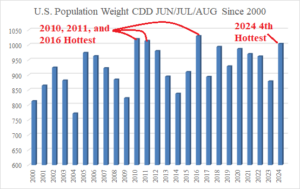
Fig. 1: U.S. population weight CDD totals for JUN/JUL/AUG for 2000-2023 vs. 2024 projection.
Discussion: The short-term heat across the high population northeast quadrant of the U.S. is expected to repeat during summer 2024 and consequently the U.S. population weight CDD forecast has increased again (Fig. 1). The JUN/JUL/AUG 2024 projection is 1004 CDD ranking 4th hottest of this century trailing only 2016 (1030), 2010 (1020), and 2011 (1014). El Nino to La Nina transitions were observed in 2010 and 2016 which is expected in 2024. La Nina was in-place for 2011. The Climate Impact Company U.S. selected cities CDD forecasts have steadily increased for both MAY-SEP and JUN/JUL/AUG (Fig. 2). The 3 hottest city forecasts for JUN/JUL/AUG are Albany, NY; Denver, CO; and Portland, OR. Causal to the hotter forecasts is the drying effect on soil moisture which is well-correlated to hotter weather and notable across the high population East U.S. in June (Fig. 3) and the warming SSTA off the California and the Northeast U.S. during the past 30 days (Fig. 4-5).
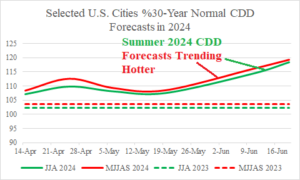
Fig. 2: U.S. selected cities JUN-AUG and MAY-SEP percent of 30-year normal forecasts for 2024 vs. last year.
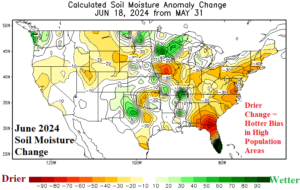
Fig. 3: The June (so far) soil moisture change is much drier across the East causing a hotter temperature bias.
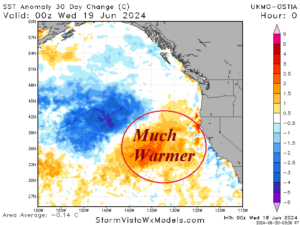
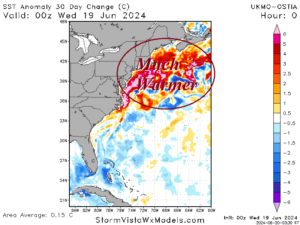
Fig. 4-5: The 30-day change in sea surface temperature vividly displays support for warmer/hotter weather off the California and Northeast Coast.