
Issuing Heat Alert for Central/South-central U.S. Late July
07/15/2025, 4:59 am EDT
Comparing Best Dynamic and Machine Learning Forecast Models for Australia Outlook
07/18/2025, 5:44 am EDT
Climate Impact Company Early U.S. Notes
Issued: Thursday July 17, 2025
Highlight: Heat wave!
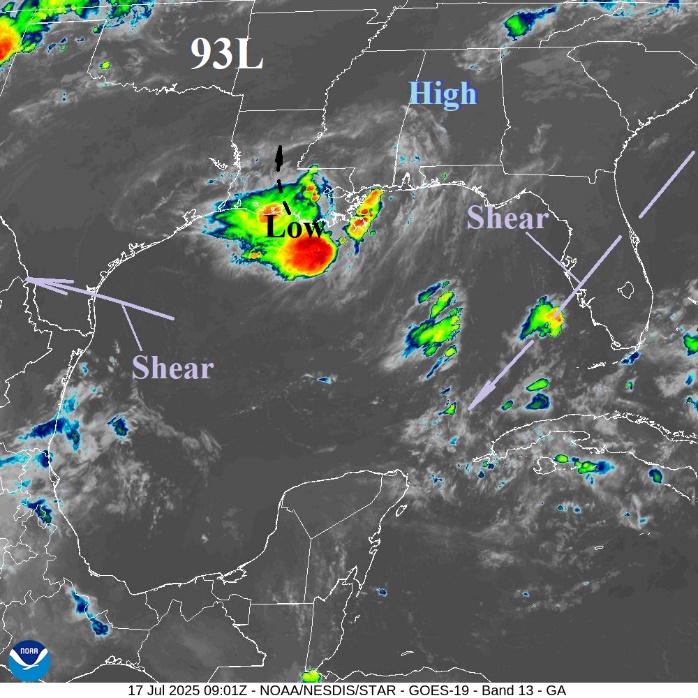
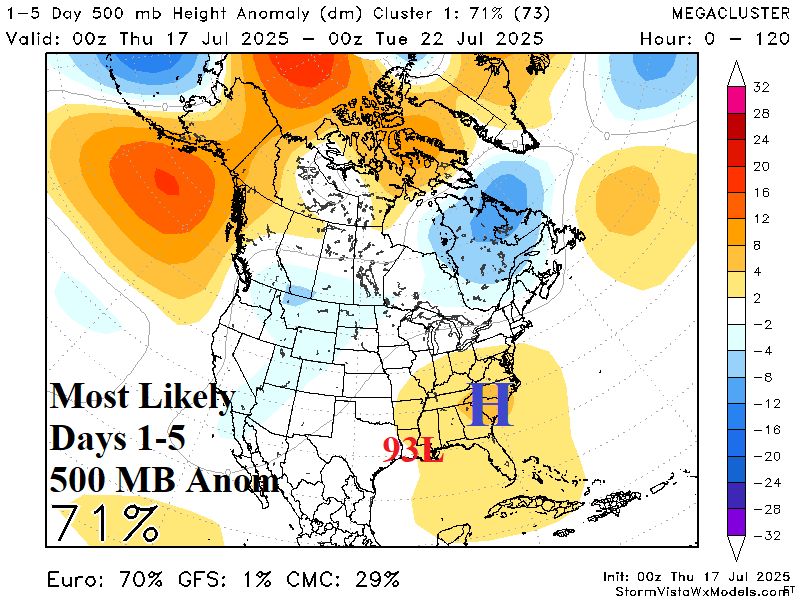
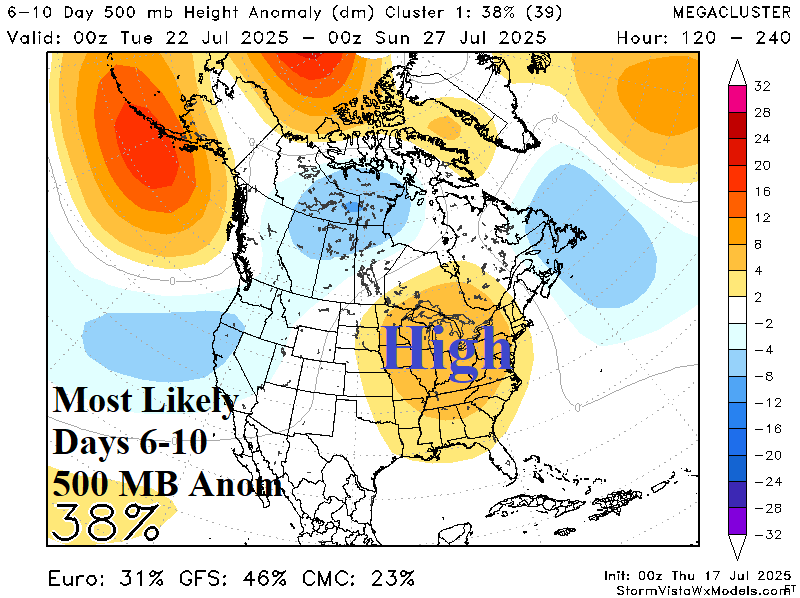
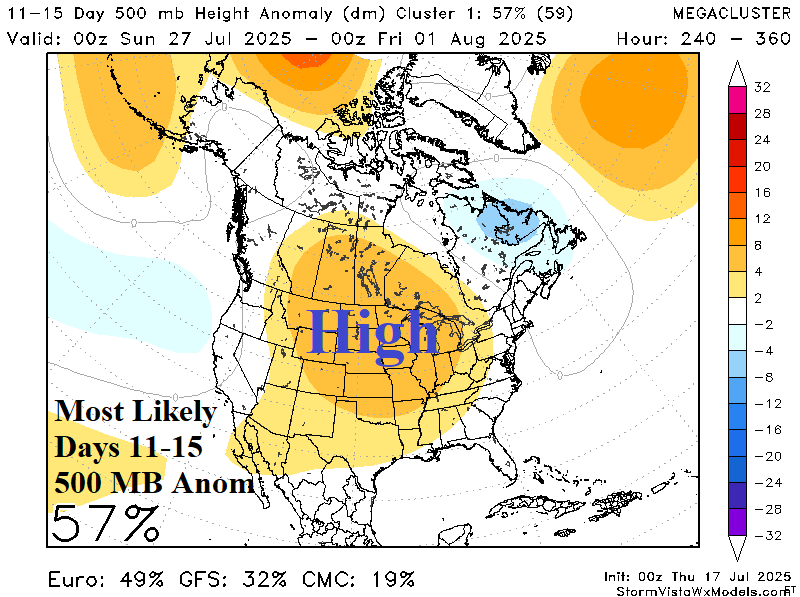
Fig. 1-4: Morning satellite view of the Gulf of Mexico and mega-cluster ensemble “most likely” 500 MB forecasts through the next 15 days.
Discussion: Dry air is choking Tropical Disturbance 93L and preventing development (Fig. 1). 93L moves inland over Louisiana today unloading 3-6 inches of rain across the coastal region. A Flood Watch covers the entire southern half of Louisiana. The latent heat release of the stagnant convection over the next 2-3 days is released into the middle atmosphere to the north and forces a high-pressure area to build (Fig. 2). The-high pressure area is forecast to amplify, according to the mega-cluster ensemble, reaching across the East-central U.S. in the 6-10-day period (Fig. 3). The high-pressure area expands in the 11-15-day period shifting westward to the Great Plains (Fig. 4). The sensible weather pattern features extreme heat in this scenario combining hot ambient air temperature with high humidity to produce heat stress hazardous to human health, the U.S. electricity grid, and various crops plus water supply given the attendant dryness. The risk of >100F affects the Great Plains, South, and Southeast U.S. in the 6-10-day period (Fig. 5) expanding northward in the 11-15-day period (Fig. 6). The 6-week U.S. population weight CDD forecast identifies a second national heat spike for the last week of July (Fig. 7). Note that persistence continues to outperform the week 4-6 analog forecast. The short-term outlook identifies the “sizzle” forecast for July 25-31 (Fig. 8).

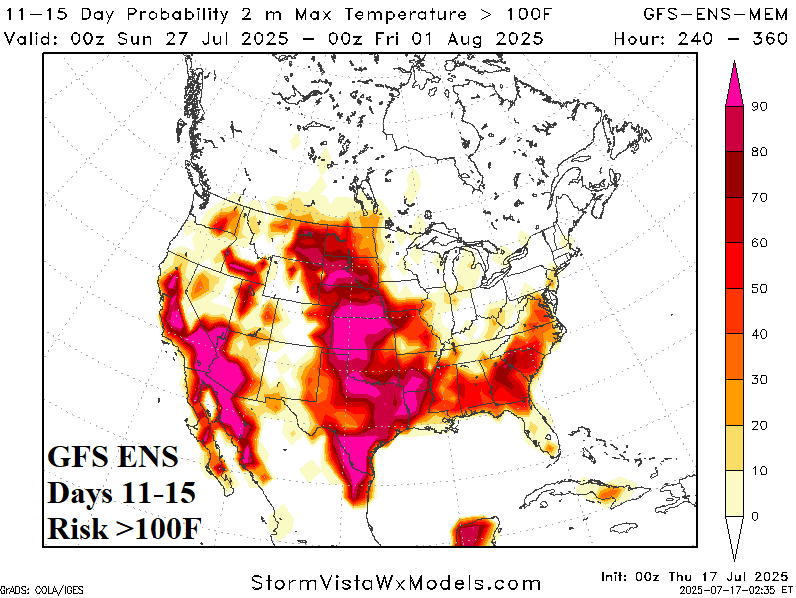
Fig. 5-6: GFS ENS U.S. risk of >100F forecast for the medium range.

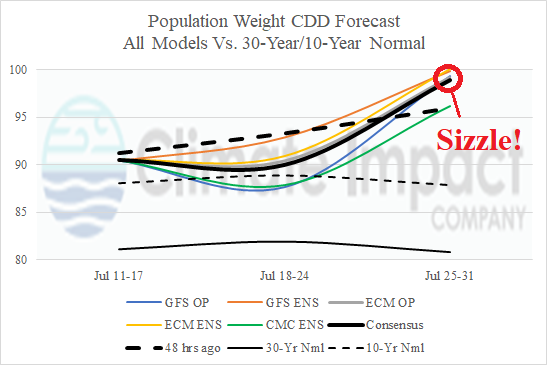
Fig. 7-8: U.S. population weight CDD forecasts through the next 6 weeks and the short-term forecast.