
NOV-25 Solar Cycle/Sunspot Number: Deceleration to Solar Minimum Underway
12/08/2025, 2:59 pm EST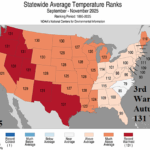
3rd Warmest Autumn on Record in the U.S.; November 4th Warmest
12/11/2025, 8:36 am EST
Climate Impact Company Dynamic/AI Models Verification Report
Issued: Wednesday, December 10, 2025
Highlight: Is the lack on equatorial warm SSTA contributing to wet bias of operational/AI 15-day forecasts?
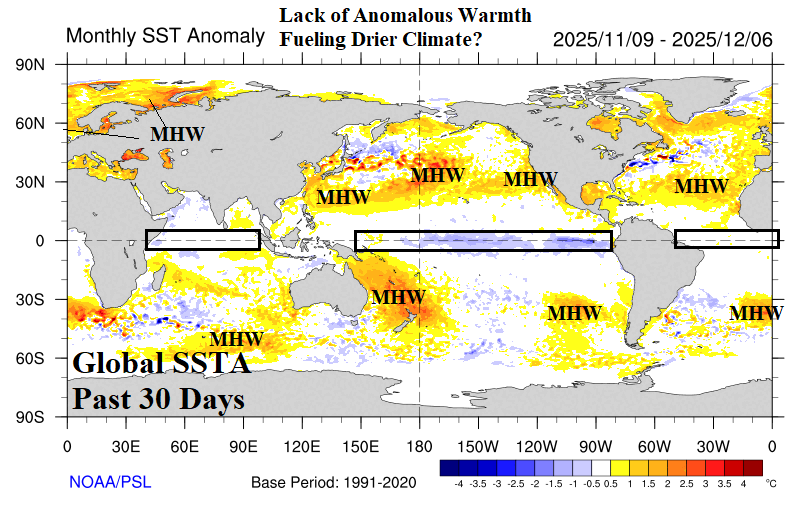
Fig. 1: The global SSTA analysis for the past 30 days.

Fig. 2: The NOV-25 percent of normal precipitation.
Discussion: During the past 30 days, the global equatorial SSTA regime has shifted remarkably away from anomalous warmth (Fig. 1). La Nina has cooled the central and equatorial Pacific Ocean while heavy convective rains in November helped to cool waters in the Maritime Continent region while a recent strong negative Indian Ocean dipole (-IOD) lost intensity. The diminished equatorial warm SSTA, including the weakened meridional SSTA contrast across the equatorial region, may have contributed to limited anomalous global precipitation during November (Fig. 2). The exception is Indonesia and vicinity where over-achieving rains, including late season tropical cyclone activity, caused widespread flooding. The remainder of the tropics were mostly drier than normal and contributed to poleward below normal precipitation most evident in the Americas. The general lack of precipitation may be a contributor to a wet bias of operational and AI 15-day forecasts for North and South America plus Europe. The ECM ENS is characteristic of all operational forecast models producing a wet forecast bias in 15-day outlooks for the past 30 days for the Americas (Fig. 3-4). AI models have a similar common problem as demonstrated by AIFS ENS for Europe (Fig. 5).
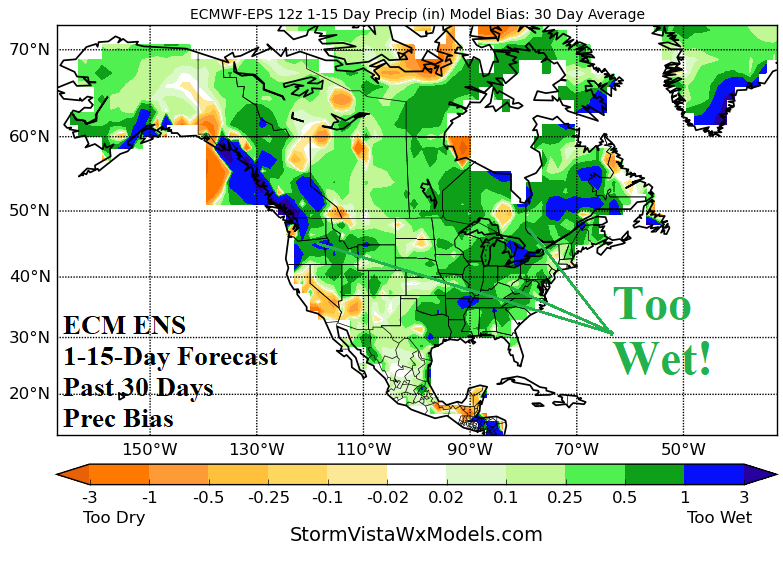


Fig. 3-5: The ECM ENS precipitation forecast bias for the past 30 days for 15-day forecasts in North and South America plus the AIFS ENS 15-day precipitation forecast bias for the past 30 days across Europe.