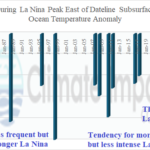
Subsurface Moderately Cold in Equatorial East Pacific as La Nina Likely to Linger well into NH Spring
02/02/2025, 9:44 am EST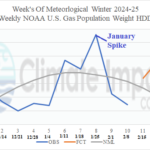
Natural Gas Prices and U.S. Thermal Pattern for winter 2024-25 So Far
02/13/2025, 11:38 am EST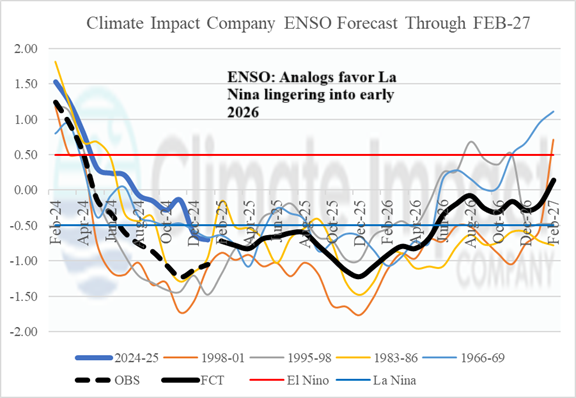
Executive summary: The Climate Impact Company ENSO, PDO, AMO, and IOD constructed analog forecasts are updated. The ENSO outlook increasingly favors 2025 as a La Nina year while cool phase PDO continues until a possible phase change early next year. The very warm North Atlantic surface does not change in 2025 as strong +AMO continues. The IOD regime is neutral into mid-year and uncertain into 2026.
Discussion: A review and forecast of the El Nino southern oscillation (ENSO) based on the Nino34 index, Pacific decadal oscillation (PDO), Atlantic multi-decadal oscillation (AMO), and Indian Ocen dipole (IOD) is provided. The forecasts are based on a constructed analog with 12-month regression. The Nino34 forecast extends to February 2027 while PDO, AMO, and IOD outlooks are through February 2026.
- ENSO: Currently, ENSO is classified as weak-to-moderate La Nina. Moderate intensity La Nina requires an index of -1 or lower for both Nino34 SSTA and multivariate ENSO index (MEI). The Nino34 SSTA is not quite at the moderate La Nina threshold while MEI is at -1. In the equatorial Pacific Ocean, east of the Dateline, the subsurface temperature anomaly for January was -1.33 which is about 60% of the 1998 intensity when the strongest La Nina since 1950 was observed. The current La Nina is very reactive to passage of Madden Julian oscillation (MJO) which causes temporary weakening of La Nina. Usually, the cooler than normal waters in the eastern equatorial Pacific Ocean during La Nina resist MJO passage. The southern oscillation index (SOI) has shifted to very positive during the past 7-10 days. However, the approach of another MJO episode may weaken the +SOI regime during mid-to-late February. The constructed analog forecast maintains weak to moderate La Nina into Q2/2025 when weakening to near neutral phase may occur ( 1). Due to the relative warmer than normal ocean surface in the western tropical Pacific Ocean and in the subtropics of both hemispheres coupled with the relative cool SSTA of the eastern equatorial Pacific, a La Nina climate is projected through mid-year despite potential neutral oceanic La Nina. Similar with a collection of (NOAA) dynamic and statistical Nino34 forecasts, La Nina is forecast to regenerate later in 2025 and carry through Q1/2026 followed by neutral ENSO for much of 2026. Climate regimes associated with La Nina are likely dominant in 2025. Examples are evolving Southern U.S. drought, above normal precipitation in the Northwest U.S., wetter conditions for Northern Brazil while Argentina is drier, wet climate across Southeast Asia to Indonesia and parts of the north and east coasts of Australia, plus dry risk in East China.
- PDO: Since early 2020, the cool phase of PDO has dominated including record strength at times. However, the long-duration and intense -PDO of the past 5 years is much different from other intense -PDO regimes of the past. The current -PDO is generated by extremely warm SSTA in the West and Central Pacific Ocean compared with relatively cool SSTA in the Northeast Pacific. Normally, a strong -PDO regime produces cooler than normal ocean surface for the entire Northeast Pacific. During recent years the Northeast Pacific has averaged near to warmer than normal but much cooler than the prohibitive warmth to the west. The anomalous warm water is fueled by marine heatwaves (MHW) prominent in the Northeast Pacific last decade shifting westward in the current decade. The constructed analog forecast is interesting. The cool phase continues in 2025 while slowly weakening and shifts toward positive phase in 2026 ( 2). Potentially, the implication is for a redeveloping MHW in the Northeast Pacific sufficiently warm to surpass the prevailing warmth of the Northwest Pacific. If so, evolution of a persistent West Coast of North America upper ridge would enhance widespread drought risk.
- AMO: The ongoing warm phase of AMO has weakened slightly mid-winter although remaining part of the strongest +AMO on record extending throughout the current decade, most notable the past 2 years. MHW’s have enhanced the warming most recently west and southwest of Europe, the Caribbean Sea, and occasionally the Gulf of Mexico and deep tropics plus the Norwegian Sea north of Europe. The western North Atlantic cooled during the last third of 2024 but is regaining anomalous warmth in recent weeks. The constructed analog forecast identifies the difficulty attaining sufficiently warm analog years to match the current regime. Certainty is conveyed sustaining +AMO for 2025 although whether the extreme warm intensity continuing is less apparent. Given the La Nina climate forecast and persistent anomalous warmth of the North Atlantic another dangerous hurricane season is ahead in 2025.
- IOD: The IOD pattern has been very changeable in recent months, sometimes showing negative phase and at other times backing off. Suspected is the active MJO causing the uncertain IOD regime. A MHW northwest of Australia has occasionally caused IOD to shift into brief negative phase. The constructed analog forecast favors neutral phase for the next several months ( 4). Mid-to-late 2025 is uncertain with both outlier positive and negative phase possible. The consensus of a large disparity in IOD analogs is neutral phase for 2025 although forecast confidence is low.

Fig. 1: The Climate Impact Company constructed analog forecast of the Nino34 SSTA through February 2027.
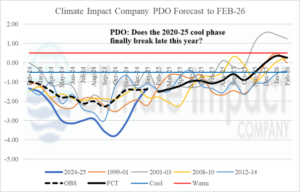
Fig. 2: The Climate Impact Company constructed analog forecast of the Pacific decadal oscillation through February 2026.
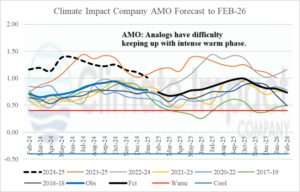
Fig. 3: The Climate Impact Company constructed analog forecast of the Atlantic multi-decadal oscillation through February 2026.
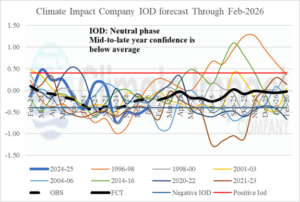
Fig. 4: The Climate Impact Company constructed analog forecast of the Indian Ocean dipole through February 2026.