January 2023 U.S. State Temperature and Precipitation Rankings: Record Warm New England!
02/08/2023, 2:53 pm ESTSharp Cold Front into Argentina Thursday Triggers Thunderstorms Then Cooler Temperatures in Drought Area
02/14/2023, 2:57 pm ESTHeadline: La Nina dissipates over the next 1-3 months. El Nino onset by mid-2023. Following (El Nino) intensity uncertain.
Executive summary: The Madden Julian oscillation (MJO) is forecast to shift eastward across the equatorial Pacific Ocean during the next 2 weeks. Following passage of the MJO, equatorial wind shifts to west or southwest and eliminates trade winds. The lack of trade winds eliminates the up-welling process that sustains La Nina. Oceanic La Nina 2020-23 likely dissipates by March 1st. The southern oscillation index (SOI) remains in the positive phase and is forecast to remain so through February despite the eastward shift of the MJO. Therefore, the La Nina climate (represented by +SOI) continues. The next MJO episode, likely to occur in late MAR/early APR points oceanic ENSO toward El Nino while the El Nino climate finally fades. The consensus of forecast models is that El Nino onset is likely with yet another MJO episode (occurring every 6 weeks) in the MAY/JUN timeframe. Dynamic models indicate a potential robust El Nino by AUG/SEP while analogs are not as strong. El Nino is likely to continue into 2024.
Discussion: To weaken and eliminate La Nina and point ENSO in the direction of El Nino, a sequence of intra-seasonal transient tropical oscillations (known as Madden Julian oscillation) is necessary. MJO events are 7-10-day mini-El Nino-like climate producers that cause brief El Nino-like climate and allow the equatorial Pacific to warm both at surface and subsurface levels. The MJO event located north of Australia now is forecast to shift eastward across the equatorial Pacific over the next 2 weeks (Fig. 1). This MJO event is the 3rd in a sequence which began last November (Fig. 2). An active MJO cycle operates on a 4-6-week timescale. Consequently, projections of a 4th and 5th MJO event for late March and again in early May are confident. If so, forecast confidence is above average that oceanic and atmospheric La Nina will dissipate, and an El Nino onset (by MAY/JUN) will initiate.


Fig. 1-2: The 15-day MJO forecast indicates an increasingly robust episode crossing the equatorial Pacific Ocean during the next 15 days, the 3rd event in the sequence.
Unique to La Nina 2020-23 especially during recent months is the persistence of +SOI despite occasional weakening of the La Nina signal in the Nino34 SSTA region. The explanation for this unique condition is the strong semi-permanent subtropical high-pressure area in the northeast South Pacific basin keeping sea level pressure (SLP) higher than normal at Tahiti. Meanwhile, especially lately, MJO episodes enhance low pressure at Darwin. The lower SLP at Darwin to the north of Australia compared to the higher than normal pressure at Tahiti in the Christmas Islands maintains the strong +SOI pattern somewhat independent of ENSO. The northeast South Pacific semi-permanent high pressure area has warmed the atmosphere in that region and continued to the devastating drought in Chile including the recent horrific fires near the central Chile Coast. This phenomenon has caused substantial warming of waters off the West Coast of South America recently spreading northward and into the Nino12 SSTA region.
Another leading diagnostic to monitor ENSO phase is noting the trend in the equatorial Pacific subsurface temperature anomalies, or upper ocean heat. Last September, before onset of the MJO sequence, the equatorial East Pacific was robustly cool and trade winds forced by La Nina upwelled that cool water to maintain a robust cold ENSO pattern (Fig. 3). As February 2023 arrives, the cool waters have weakened although remain sufficiently plentiful to maintain a weak La Nina (Fig. 4). The MJO sequence is slowly allowing the West Pacific subsurface warmth to shift farther east of the Dateline. Normally, 3 MJO events erode the cool East Pacific subsurface signature. However, the 2020-23 La Nina may require up to 5 MJO events to allow the East Pacific to warm.


Fig. 3-4: The subsurface equatorial Pacific Ocean temperature anomaly structure from this past September compared to early February.
A collection of all ENSO phase forecast models from the International Research Institute (IRI) for Climate and Society at Columbia University indicates a consensus of dynamic models projects El Nino onset during MAY/JUN/JUL with a robust El Nino by JUL/AUG/SEP (Fig. 5). ECMWF is a contributor to the more aggressive El Nino forecasts. Statistical (analog) forecasts are somewhat less aggressive with El Nino delaying onset until AUG/SEP/OCT. The Climate Impact Company (CIC) ENSO phase projection uses multivariate ENSO index (MEI) of 3 lengthy La Nina events (similar to the 2020-23 episode) and averages what followed each episode to project the 2023 ENSO phase. MEI is used due to the more appropriate representation of the stubborn and lingering La Nina climate pattern unique to the 2020-23 La Nina rather than the conventional Nino34 SSTSA index. The MEI-based analog reveals a weak El Nino onset by July and lack of following robust El Nino (Fig. 6).
Summary: La Nina demise is forecast over the next 1-3 months. Forecast confidence is above average that weak El Nino follows by mid-year. Following El Nino intensity is uncertain and for now a weaker El Nino for the second half of 2023 is indicated.

Fig. 5: A collection of all dynamic and statistical ENSO phase forecast models by the International Research Institute for Climate and Society at Columbia University.
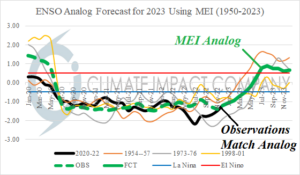
Fig. 6: The Climate Impact Company ENSO phase analog forecast using MEI.