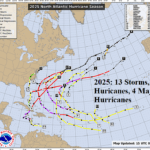
North Atlantic 2025 Tropical Cyclone Season Review, Preliminary 2026 Forecast
12/01/2025, 4:38 pm EST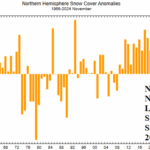
Northern Hemisphere Snow Cover for NOV-25 Near Normal But Lowest Amount Since 2009
12/05/2025, 6:30 am EST
Climate Impact Company Dynamic/AI Models Verification Report
Issued: Thursday, December 4, 2025
Highlight: AIFS skill scores are best for medium range North America/Europe temperature forecasts; Ongoing wet bias in Brazil.
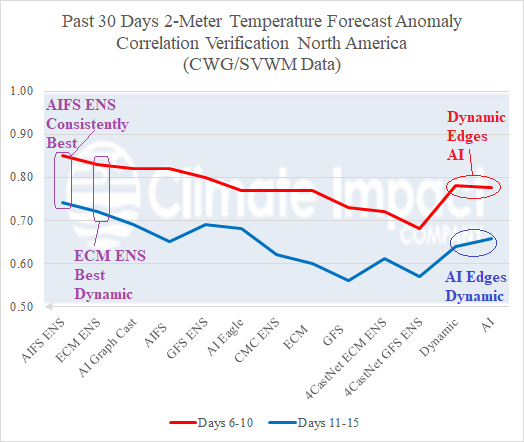
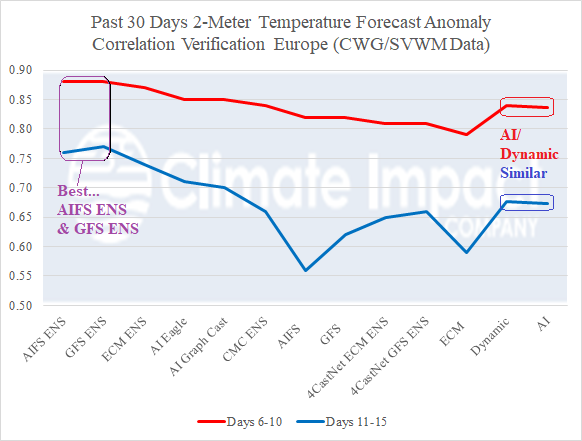
Fig. 1-2: Past 30 days 2-meter temperature forecast anomaly correlation verification for North America and Europe using CWG/SVWM data.
Discussion: Given the sharp increase in medium-range temperature anomaly forecasts for North America and Europe as meteorological winter 2025-26 arrives a review of 30-day skill scores using anomaly correlation is provided. For North America, as observed throughout most of 2025, AIFS ENS and ECM ENS are the top 2 forecast models (Fig. 1). Anomaly correlation skill scores in the 0.85 range for the 6-to-10-day period are considered good too very good with a similar reliability near 0.70 in the 11-15-day period. The skill score drops about 20% for both time periods for the least skillful models. The consensus of dynamic and AI model scores is very close for both time periods. In Europe, AIFS ENS reigns supreme once again this time very close to GFS ENS as the best medium-range 2-meter temperature forecast (Fig. 2). In the 6-10-day period, skill score drop off from best-to-worst model is minimal and dynamic vs. AI models are almost exactly, the same. In the 11-15-day period, during the past 30 days, skill scores by top models AIFS and GFS ENS are slightly better than the best forecast models for North America. However, the drop-off in skill scores to the worst models (AIFS and ECM) is higher than observed across North America. Knowing skill scores and what model is performing best in the medium/extended range is essential to the energy industry as markets grapple with how long the current U.S. cold lasts and whether the mild climate in Europe reverses colder. Another high visibility commodities market entering meteorological summer in the southern hemisphere are rainfall forecasts for South America crops. The 15-day forecasts are, on average, too wet across Brazil. The wet bias is apparent with all dynamic models including the generally most reliable ECM ENS (Fig. 3). A wetter shift in the pattern to Brazil is expected but, so far (during warm season), models are over-forecasting rain in Brazil. The 15-day rainfall forecast bias is marginally wet across Australia during the past 30 days by most forecast models including ECM ENS (Fig. 4). Finally, a look at extended range (days 16-30) temperature forecasts for North America and Europe according to AI models reveals that on average a warm bias exists across the East U.S. and cold bias for the West States (Fig. 5). Yes, the cold East U.S. late calendar autumn is a surprise. In Europe and Western Russia, the 16-30-day temperature bias, on average by AI models, is too cold across the Black Sea region and Western Russia (Fig. 6) where (due to lack of snow cover) the cold season is off to a warm start.

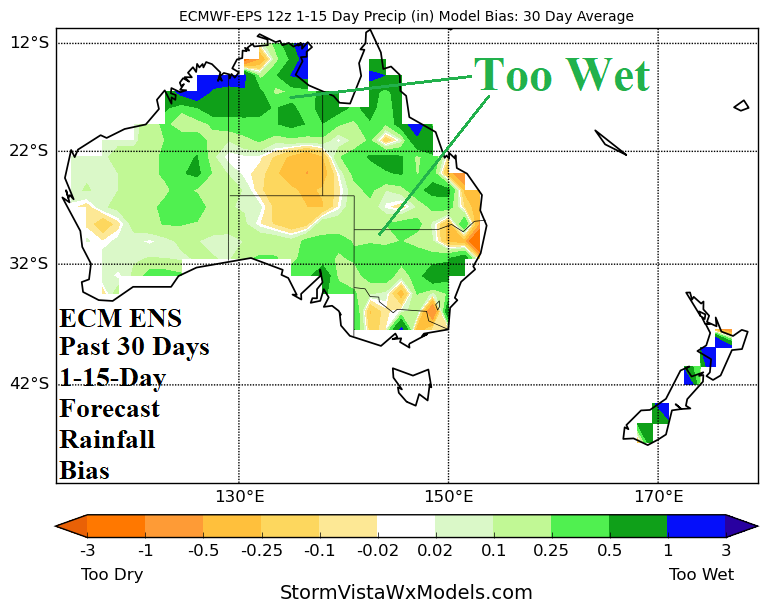
Fig. 3-4: ECM ENS 15-day forecasts and the rainfall forecast bias for South America and Australia.
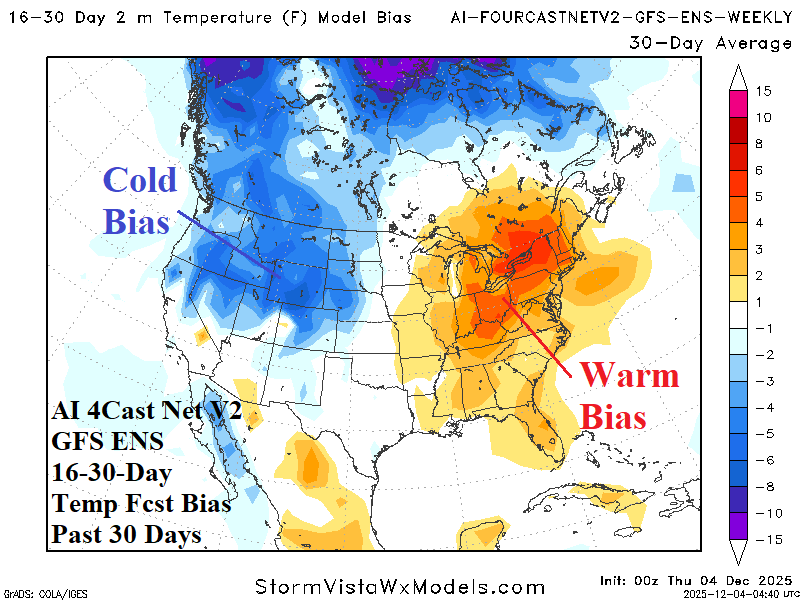

Fig. 5-6: AI 4CastNet V2 GFS ENS 16-30-day temperature forecast bias across the U.S. for the past 30 days and for Europe utilizing the 4CastNet V2 ECM ENS.