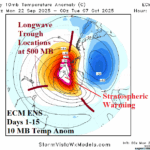
Stratospheric Warming Episode Underway Over Antarctica
09/22/2025, 5:19 am EDT
Expanding Early Season Snow Cover in Russia
09/24/2025, 6:02 am EDT![]()
Climate Impact Company Daily Feature
Issued: Tuesday, September 23, 2025
Highlight: Almost La Nina, expanding Southern U.S. drought, solar maxima 25 is behind us.
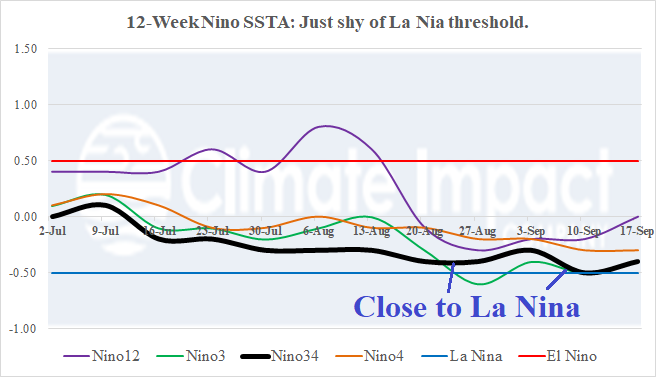
Fig. 1: The 12-week Nino SSTA observations.
Discussion: La Nina evolution is forecast for Q3/2025. So far, SSTA have cooled during late summer to approach the La Nina threshold (Fig. 1). Last week, the Nino34 SSTA warmed slightly. La Nina onset is delayed until late OCT/early NOV and the event is likely weak and ends by late Q1/2026. The expected La Nina climate through the cold season ahead in the U.S. is well-correlated to drought across the northwest and north Gulf of Mexico states extending to the southern Great Plains (Fig. 2). The weak La Nina persists early next year therefore heading into spring 2026, a large Southern U.S. drought is likely. Note drought in the Northwest and Northeast U.S. should ease. Solar cycle 25 peak intensity has passed, and we begin a new solar cycle whose minimum is forecast for 2030-31 (Fig. 3). Prior to the solar cycle 25 peak, forecasts made claimed a potential weak minimum similar with the last solar peak may occur which would set-up the possibility of a Dalton Minimum (3 consecutive solar minimum last observed 1800-1830 when the planet cooled slightly). Other forecasters projected an all-time record strength solar cycle maximum peak. Verification reveals peak was somewhere in-between.
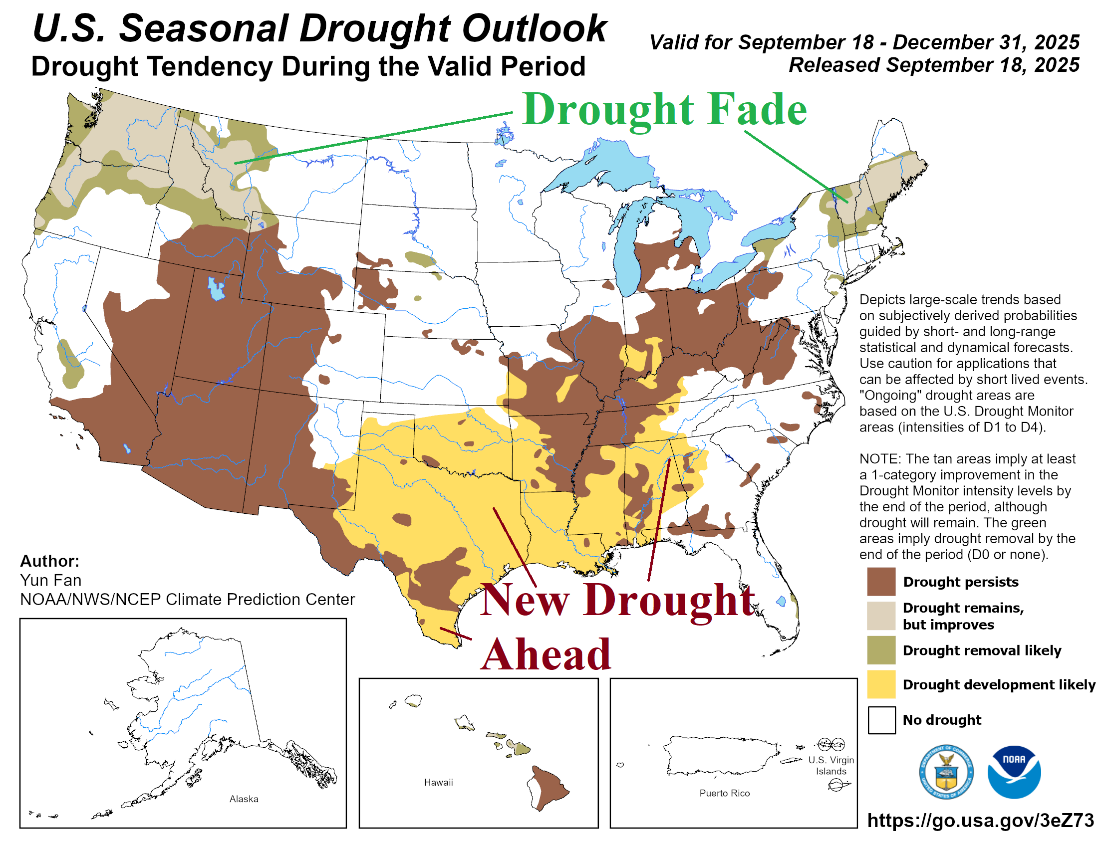
Fig. 2: Last week’s NOAA/CPC seasonal drought outlook for the U.S.
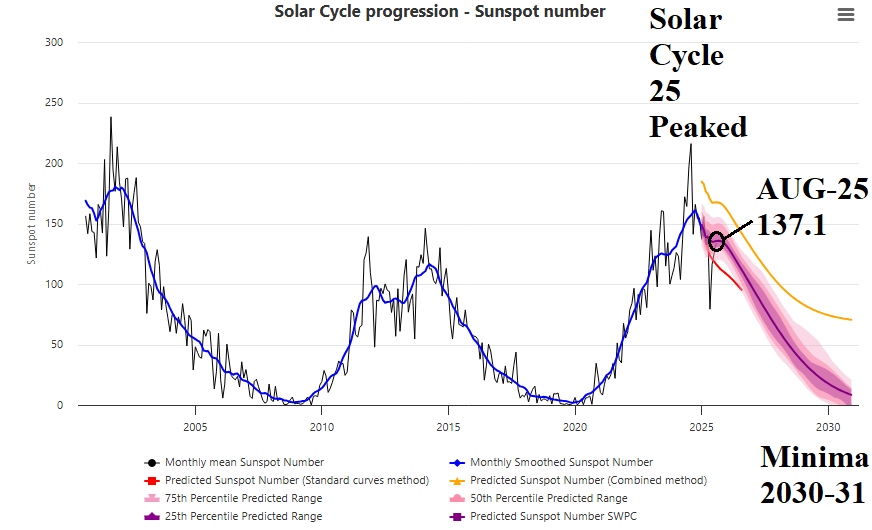
Fig. 3: Solar cycle/sunspot number for this century.