
Climate Signals Indicate More Interesting Cold Weather for U.S.
11/11/2025, 2:43 pm EST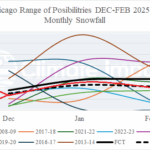
Chicago and Boston Winter 2025-26 Snowfall Forecast
11/17/2025, 4:34 am EST
![]()
Climate Impact Company Midday Update
Issued: Friday November 14, 2025
Highlight: Is the 12Z GFS arctic air in the 11-15-day period real?
![]()
Fig. 1: The 12Z GFS 15-day East Pacific oscillation forecast.
Discussion: At midday, the 12Z GFS forecasts a whopping -4 value for the East Pacific oscillation (EPO) during the 11-15-day period (Fig. 1). Other models are averaging -2 at that timeframe, about half the strength (although still impressive). The strong (-4) index supports arctic air involvement and on day-15, 12Z GFS indicates zero for morning low temperatures from Colorado to South Dakota (Fig. 2). Not surprising is the 12Z GFS forecast of moderate stratospheric warming across Canada (Fig. 3) which fuels the deep longwave trough at 500 MB causing the cold outbreak (Fig. 4). Additionally, the 12Z GFS upper air forecast enables a substantial gain in snow cover in the 11-15-day period for the North-central U.S. (Fig. 5). Is the forecast overstated? Yes! The difference (from previous forecasts) is the “ridge bridge” across Alaska which forces low-level air trajectories to tap Siberian arctic air pulling that air mass into the U.S. polar vortex. The “ridge bridge” is unlikely due to the cold SSTA across the Northeast Pacific which is well-correlated to an upper trough much of the time. The upper trough is likely, and the attendant cold develops (more) slowly inspired by the snow cover part of the forecast which is correct. Sprawling arctic air is not likely!
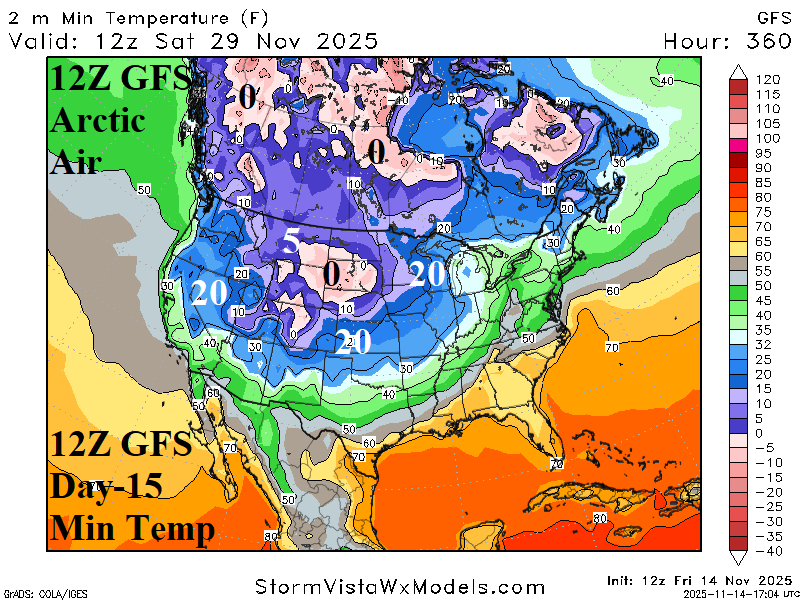
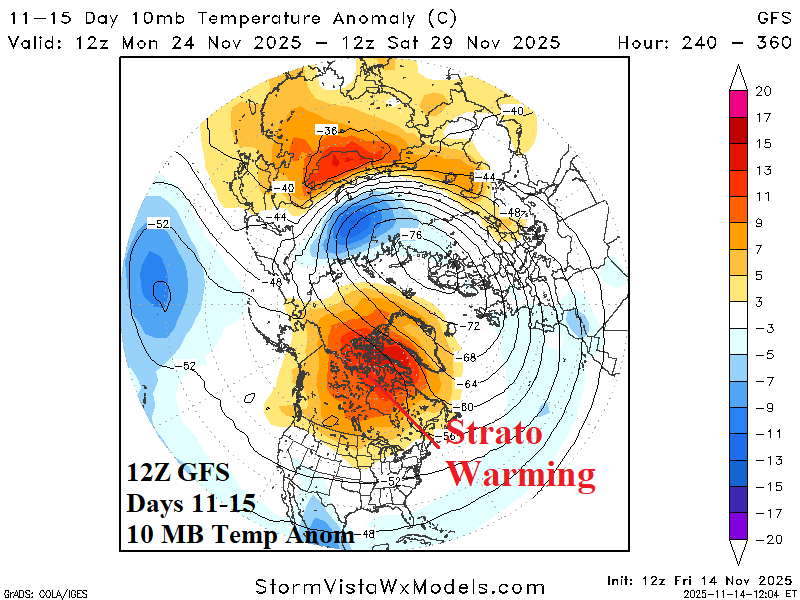
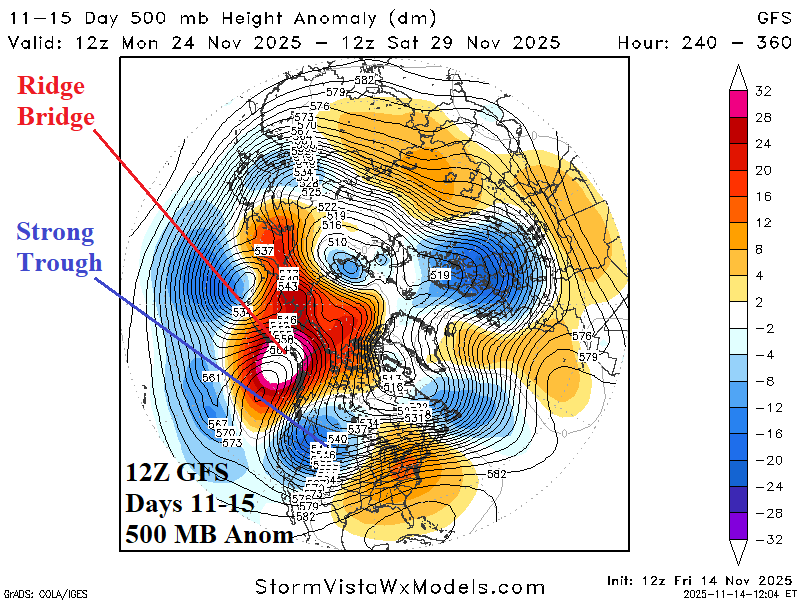
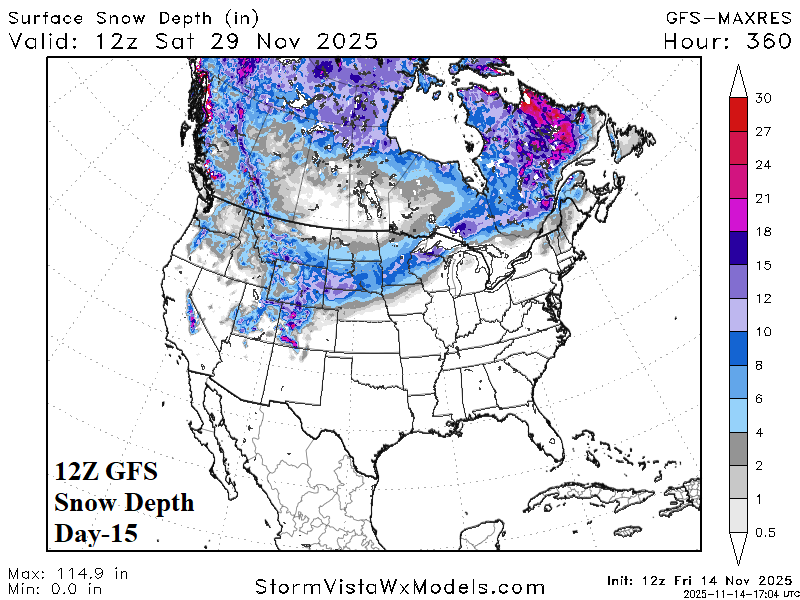
Fig. 2-5: The 12Z GFS minimum temperature forecast on Nov. 29, 11-15-day stratospheric warming over Canada, the longwave cold trough over the Northwest U.S., and day-15 snow depth.
| EIA End | Forecast | 12-Hour Change | 24-Hour Change | 30-Year Normal | 10-Year Normal |
| 11/20 | 115.5 | -2.5 | -4.5 | 134.7 | 129.8 |
| 11/27 | 112.0 | +2.8 | -25.6 | 150.4 | 145.8 |
| 12/4 | 156.8 | +0.7 | -4.9 | 165.8 | 158.2 |
Table 1: The midday 12Z GFS U.S. gas population weight HDD projections into early December.