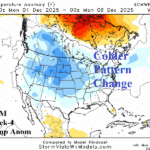
Looking Colder for December in U.S.
11/11/2025, 4:44 am EST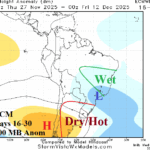
Pattern Change Ahead Great Plains, Brazil, and Europe
11/13/2025, 8:39 am EST
November 2025 Climate Impact Company Global Soil Moisture Outlook
Issued: Wednesday November 12, 2025
Highlight: Southern U.S. drought to evolve, Brazil dryness shifts into Argentina.
Executive summary: The Climate Impact Company 3-month soil moisture forecast for the southern hemisphere reveals a strong drier trend for Northeast Argentina and Southeast Brazil plus Northeast Brazil. The Central/East Brazil drought eases while dry focus shifts into Argentina. In Australia, a wet regime is likely for southwestern continent and the Queensland Coast. In the northern hemisphere, a widespread drought develops across the Southern U.S. while the northern half of the nation recovers soil moisture. Southern Europe and much of China shift much drier than normal.
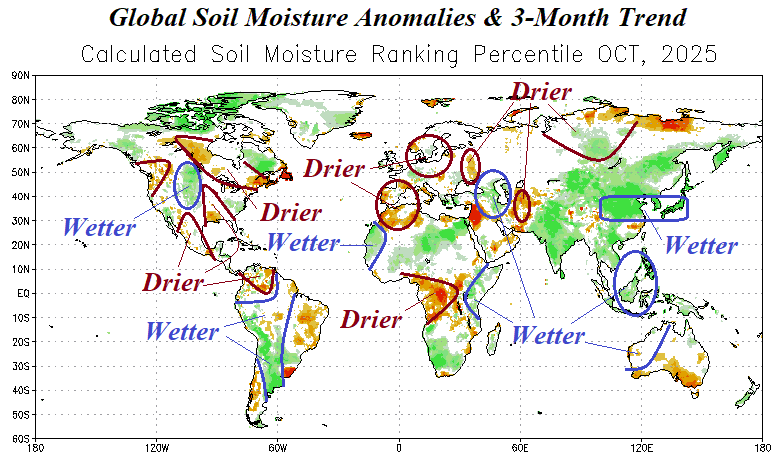
Fig. 1: October 2025 global soil moisture anomalies and 3-month trend.
Observation discussion: During OCT-25, across North America, soil moisture conditions shifted drier from Central Canada to the Great Lakes region and farther east to New England (Fig. 1). Additional drying in Canada was observed in the Southwest. Drying occurred during the past 3 months in the Mid-south States to the Gulf of Mexico Coast and across North-central Mexico. Wetter changes were generally confined to the eastern Canadian Prairies and southward through the western Great Plains. In South America, West Brazil to Peru to Argentina each shifted wetter. Only northwestern South America observed a drier shift during the past 3 months. Europe soil moisture conditions were unchanged during late summer to mid-autumn or drier. The drier zones were Southwest Europe, The Baltics to Northeast Germany, and Ukraine to Southwest Russia. Wetter conditions were observed east of the Black Sea region. The southern tropics in Africa were drier while east tropical Africa was wetter. In Asia, wetter conditions spread across Northern China and Indonesia while Central/North Russia was drier. Western Africa shifted wetter.
Forecast discussion: The outlook valid through FEB-26 includes a stormy winter across the Northern U.S. while the southern portion of the U.S. is dry (Fig. 2). In South America, dryness generates in Northeast Argentina/Southeast Brazil plus Northeast Brazil. Wet weather is likely for northwestern South America. Northwest Eurasia is snowy during the winter season while Southern Europe is likely drier than normal. In Africa, a drier regime for the southern tropics while the western equatorial continent is wetter than normal. East Asia is very dry including most of China and Southern Japan. Indonesia stays wetter than normal. Western and northeastern Australia are wet zones.
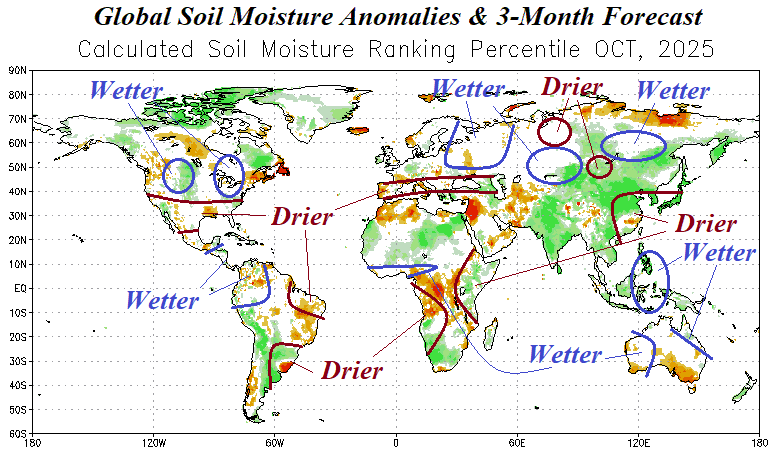
Fig. 2: The October 2025 global soil moisture ranking percentile and 3-month soil moisture forecast.
| Crop Area | November 2025 | January 2026 | March 2026 |
| Canada Spring Wheat/Soybeans | 20-30% | 15-25% | 15-25% |
| U.S. Spring Wheat | 10-15% | 10-15% | 10-15% |
| U.S. Hard Red Winter Wheat | 15-20% | 20-45% | 20-50% |
| U.S. Corn/Soybeans West | 30-40% | 30-35% | 30-35% |
| U.S. Corn/Soybeans East | 25-40% | 25-35% | 20-30% |
| Europe Wheat/Corn/Soybeans West | 30-50% | 30-45% | 30-45% |
| Europe/Wheat/Corn/Soybeans East | 30-45% | 30-40% | 30-40% |
| Ukraine | 25-45% | 25-40% | 25-40% |
| Russia Spring Wheat West | 35-45% | 25-35% | 20-30% |
| Russia Spring Wheat East | 30-35% | 25-35% | 25-35% |
| Russia Winter Wheat/Soybeans | 40-50% | 30-45% | 25-40% |
| China Wheat/Corn South & Soybeans | 20-40% | 30-45% | 35-50% |
| China Wheat/Corn North | 10-15% | 20-30% | 20-30% |
Table 1: Primary northern hemisphere crop regions and risk of drought through March 2025.
| Crop Area | November 2025 | January 2026 | March 2026 |
| 1st Corn Brazil | 35-45% | 30-40% | 30-45% |
| 2nd Corn Brazil | 25-35% | 30-40% | 30-40% |
| Brazil Coffee | 40-45% | 35-55% | 40-60% |
| Soybeans Brazil/Wheat | 35-55% | 30-45% | 30-45% |
| ARG/Wheat/Corn/Soybeans | 15-25% | 25-35% | 40-55% |
| Africa Cocoa | 30-40% | 25-35% | 20-35% |
| NW Africa Winter Wheat | 55-70% | 50-65% | 60-70% |
| Southeast Africa Soybeans | 30-35% | 30-35% | 30-35% |
| Australia Wheat | 30-45% | 35-50% | 35-50% |
Table 2: Primary southern hemisphere crop regions and risk of drought through March 2026.