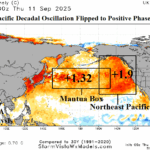
Has the Pacific Decadal Oscillation Flipped to Positive Phase?
09/12/2025, 8:42 am EDT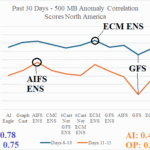
AI Models Out-performing Operational Models During Past 30 Days
09/15/2025, 1:25 pm EDT
Climate Impact Company Early AG Market ALERT
Issued: Monday September 15, 2025
Highlight: La Nina to El Nino transition during the next year is more confident, Ohio Valley drought worsening, Europe drought easing, not much Brazil rain.
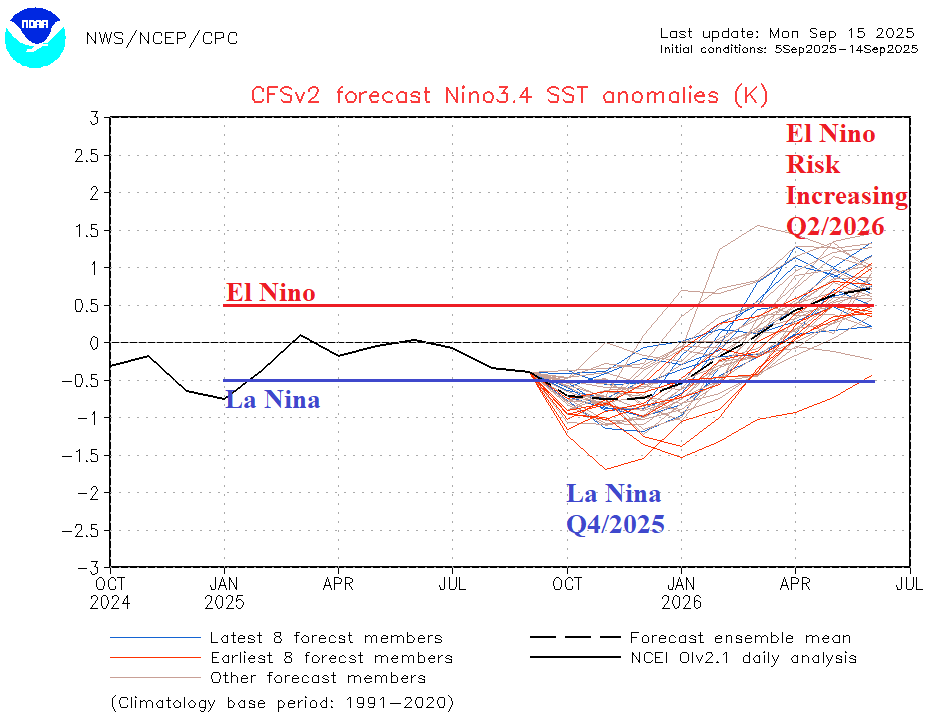
Fig. 1: The NCEP CFS V2 Nino34 SSTA forecast into middle of 2026.
Discussion: Emergence of the marine heatwave in the Northeast Pacific potentially increases the risk of El Nino in 2026 as the anomalous warm water spreads to the tropics. The NCEP CFS V2 Nino34 SSTA forecast continues to edge into El Nino territory Q2/2026. The change in ENSO will be applied to new season 1-4 ahead forecasts (Fig. 1). The upcoming La Nina is a relatively short duration episode.
In the U.S., dry soil moisture anomalies across the Midwest to Northeast States continues to strengthen (Fig. 2). Some models indicate wet weather in the 6-10-day period across the Ohio Valley. However, when looking at a 15-day percent of normal forecast, the amounts are not helpful to ease drought (Fig. 3).
The Central Europe drought is slowly easing while East Europe/Southwest Russia is worsening (Fig. 4). The accumulated rainfall forecast during the next 360 hours is mostly wet in Europe with some marginal rains into Southwest Russia (Fig. 5).
The Central/East Brazil drought remains intact (Fig. 6). The 15-day rainfall forecast is wet across northwest continent and Southeast Brazil with marginal rains only reaching the Brazil drought zone (Fig. 7).
Wet weather was observed in New South Wales during the past week (Fig. 8). The 15-day outlook reveals heavy rain in Victoria (Fig. 9).
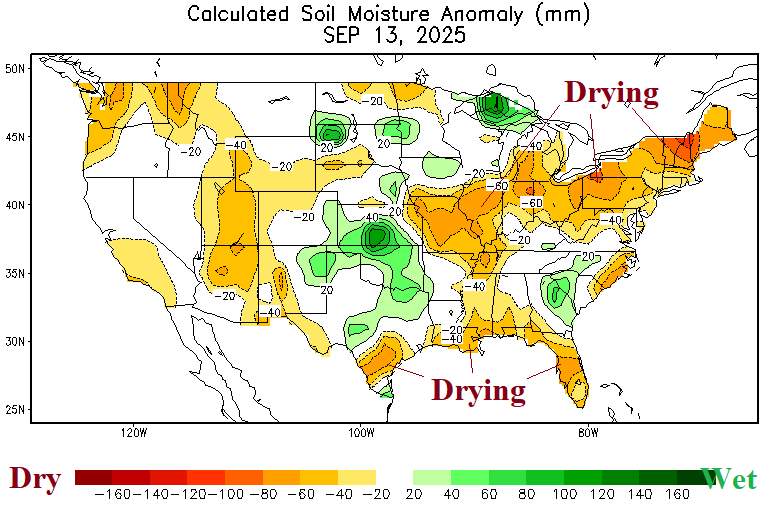

Fig. 2-3: The U.S. soil moisture anomalies analysis and ECM ENS 15-day percent of normal rainfall.

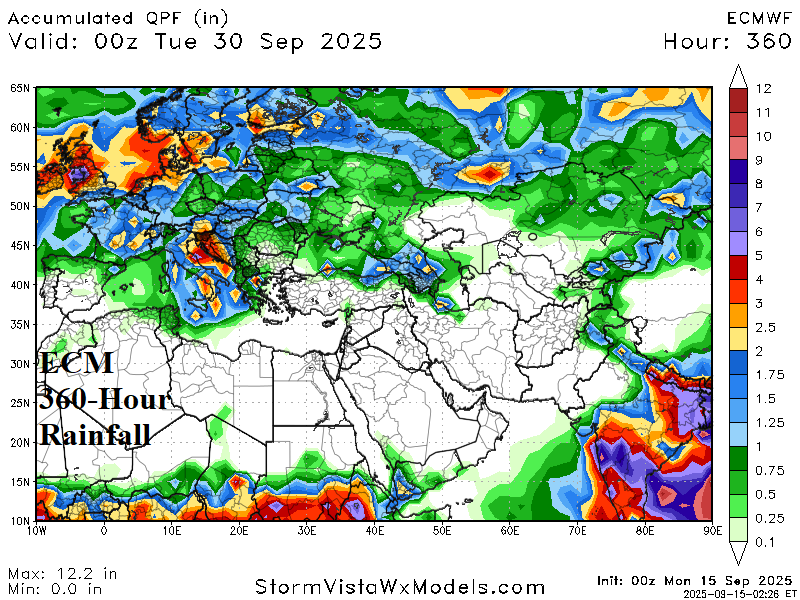
Fig. 4-5: The Europe soil moisture anomaly analysis and ECM 360-hour accumulative rainfall outlook.
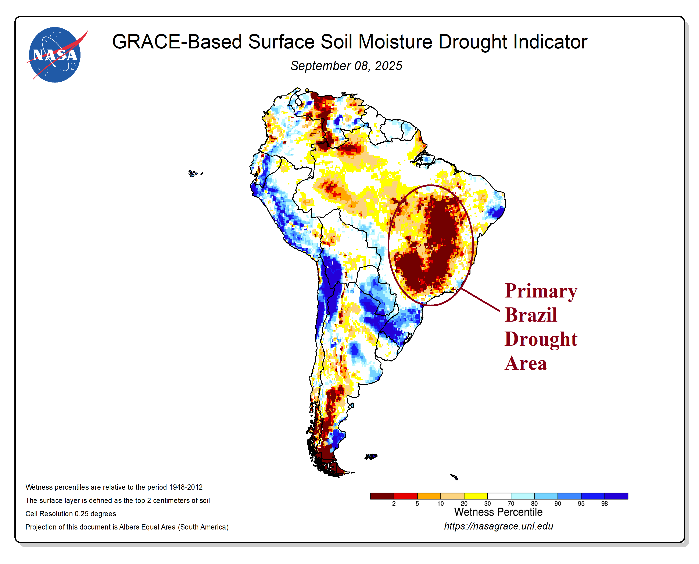
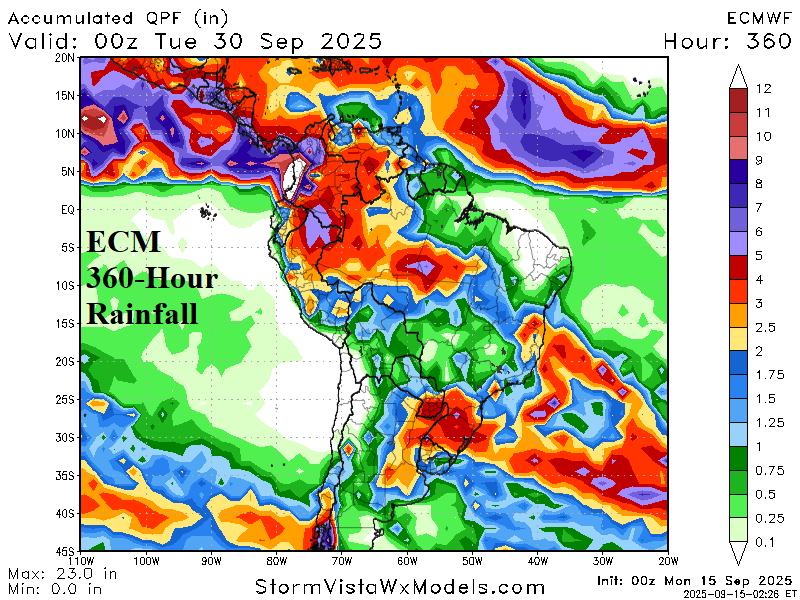
Fig. 6-7: The South America soil moisture anomaly analysis and ECM 360-hour accumulative rainfall outlook.
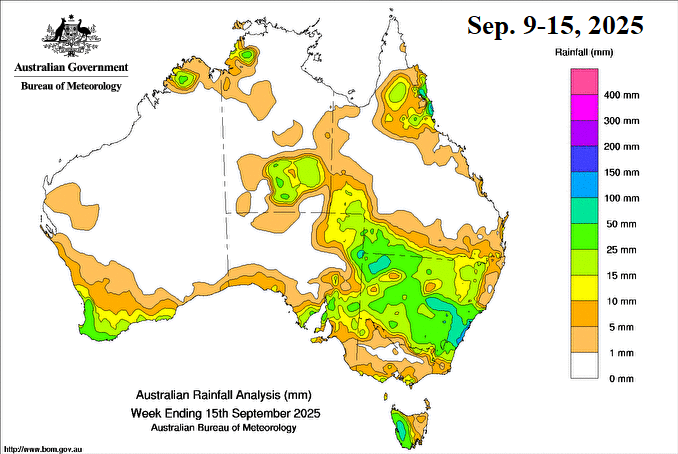
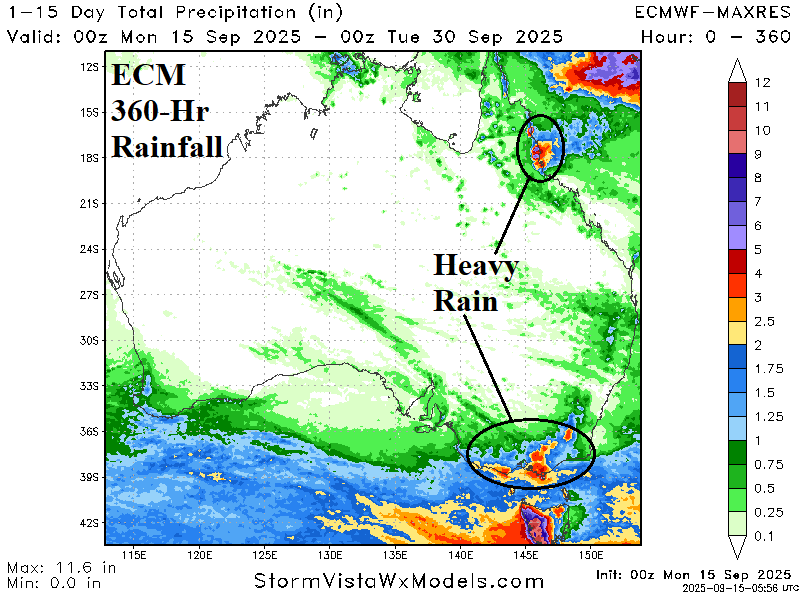
Fig. 8-9: The Australia rainfall amount verification from the past week and 15-day rainfall forecast.