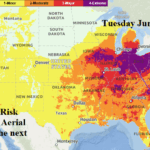
The Hottest Day of the Next 7 Days for the Midwest to Mid-Atlantic States is Next Tuesday
06/19/2025, 6:36 am EDT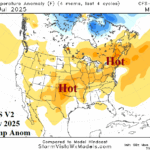
CFS V2 Projects Hot July Southwest Plains to New England and Eventually California
06/24/2025, 5:10 am EDT
Updated Climate Impact Company U.S. & Europe CDD Outlook
Headline: U.S. & Europe JJA CDD forecasts trending hotter.
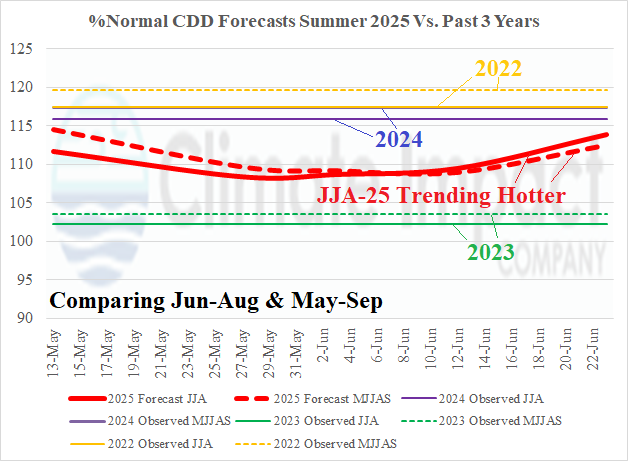
Fig. 1: The Climate Impact Company U.S. selected cities CDD forecast for JUN-AUG and MAY-SEP compared to the last 3 years versus the 30-year normal.
Discussion: The Climate Impact Company U.S. selected cities CDD forecast for 2025 is updated (Fig. 1). The summertime (JUN/JUL/AUG) CDD outlook adjusts hotter. The national average edges upward to 113.9% of the 30-year normal as the JJA-25 forecast edges close to 2022 and 2024 summertime observations which were 3rd and 4th hottest (respectively) on record. The hottest JJA city forecasts compared to the 30-year normal in order of intensity are Seattle (132.4%), Salt Lake City (124.8%), Albany (123%), Rochester (121.3%), and Pittsburgh (120.4%). The West and Northeast have the hottest bias. The coolest (least hot) JJA forecast is Dallas (100.9%) and Kansas City (102.9%). The U.S. population weight CDD forecast projects June 2025 as the 5th hottest of this century (Table 1). However, the heat is biased away from the East-central/Mid-south U.S. mid-to-late summer forcing the population weight CDD projections to 12th to 14th hottest (nationally) of this century. The forecast trend is hotter for JUL-SEP although notable is the difference between single city forecasts vs. population weight forecasts.
| June | July | August | September | |
| 2025 | 265 | 368 | 324 | 177 |
| 10-year | 252 | 371 | 332 | 190 |
| 30-Year | 213 | 321 | 290 | 155 |
| 2025 Rank (2000-2025) | 5th hottest | 12th hottest | 14th hottest | 14th hottest |
Table 1: The Climate Impact Company U.S. selected cities CDD forecast for JUN-AUG and MAY-SEP compared to the last 3 years versus the 30-year normal.
A hotter revision for the Climate Impact Company Europe Selected Cities CDD forecast especially for western cities as the MAY-JUL projections far exceed the (warm biased) 10-year normal (Fig. 2). The AUG-SEP forecast cools to near the 10-year normal. Eastern Europe selected cities are not as boldly warm-to-hot as the western cities (Fig. 3).

Fig 2: The Climate Impact Company Europe West selected cities CDD forecast for MAY-SEP 2025.
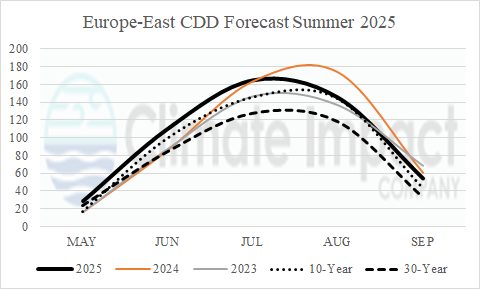
Fig. 3: The Climate Impact Company Europe East selected cities CDD forecast for MAY-SEP 2025.