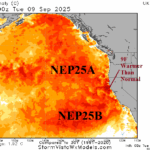
Short-lived La Nina Ahead; Vigorous Marine Heatwave Could Initiate El Nino in 2026
09/11/2025, 4:56 am EDT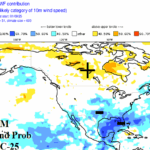
ECMWF Month 1-4 Ahead Wind Probability Forecast for U.S. and Europe
09/17/2025, 6:05 am EDT
Climate Impact Company Preliminary U.S. Winter 2025-26 Gas Population Weight HDD Outlook
Issued: Monday September 15, 2025
Headline: Warm start to winter; JAN/FEB are quite cold.
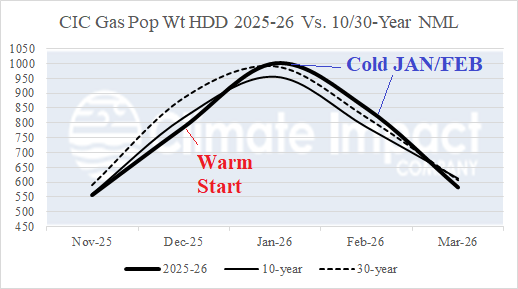
Fig. 1: The preliminary U.S. gas population weight HDD forecast for the 2025-26 heating season.
Discussion: The preliminary U.S. winter 2025-26 gas population weight heating degree day forecast is issued. The outlook indicates near the 30-year normal HDD for November, somewhat warmer than normal December, shifting colder than normal mid-to-late winter, and a mild March (Fig. 1). Due to the presence of a strong marine heatwave (MHW) in the Northeast Pacific combined with a stronger than normal North Atlantic warm hole (NAWH) south of Greenland, the risk of an “Alaskan ridge bridge” and compensating downstream polar vortex over Central Canada increases for JAN/FEB 2026 if the sea surface temperature anomaly (SSTA) patterns present now persists through meteorological winter.
Compared to the last 3 winter seasons, the 2025-26 outlook has similarities with recent winters starting warmer than normal, shifting colder as observed last year during mid-winter, and ending very cold this February much colder than recent years (Fig. 2-3).
Regionally, other than December, New England can expect higher than normal heating demand during the 2025-26 heating season (Fig. 4). The coldest NOV, JAN/FEB (nationally) is in the Ohio Valley (Fig. 5). In Texas, cold spikes similar with the last 2 years are likely in January plus a February chill (Fig. 6).
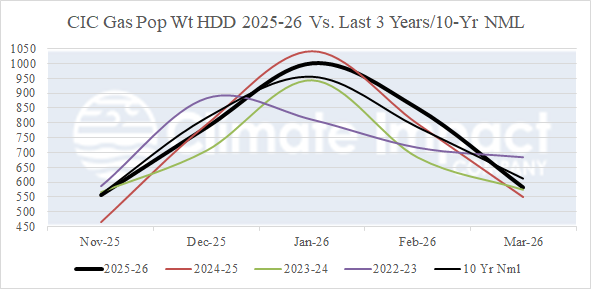
Fig. 2: The preliminary U.S. gas population weight HDD forecast for the 2025-26 heating season compared to the last 3 years and 10-year normal.
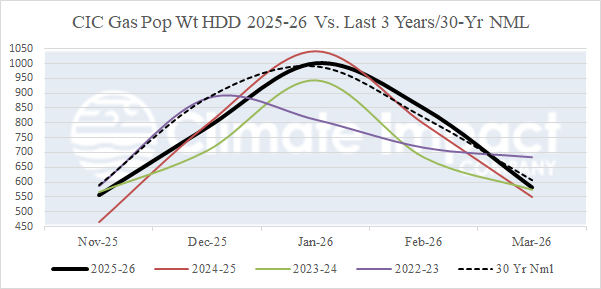
Fig. 3: The preliminary U.S. gas population weight HDD forecast for the 2025-26 heating season compared to the last 3 years and 30-year normal.
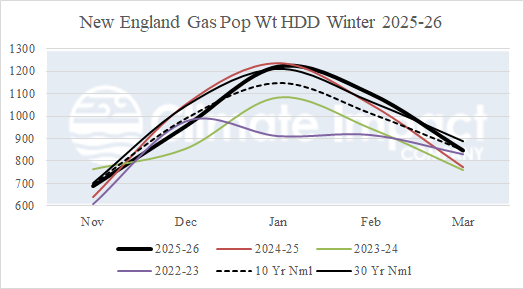
Fig. 4: The preliminary U.S. gas population weight HDD forecast for the 2025-26 heating season compared to the last 3 years and 30-year normal in New England.
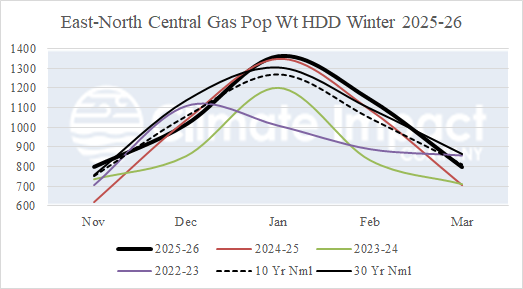
Fig. 5: The preliminary U.S. gas population weight HDD forecast for the 2025-26 heating season compared to the last 3 years and 30-year normal in the Ohio Valley.
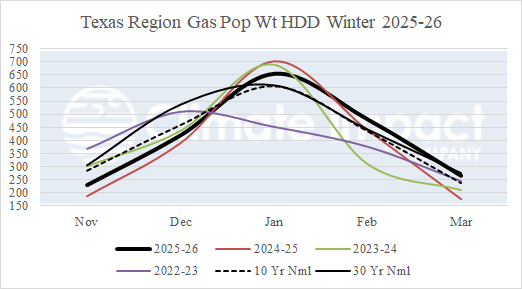
Fig. 6: The preliminary U.S. gas population weight HDD forecast for the 2025-26 heating season compared to the last 3 years and 30-year normal in the Texas region.