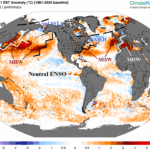
Marine Heatwaves and the June 2025 Northern Hemisphere Climate
07/02/2025, 5:51 am EDT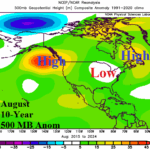
Using Optimum Climate Normal to Forecast/Validate Pattern Change
07/11/2025, 8:18 am EDT
Updated Climate Impact Company U.S. & Europe CDD Outlook
Headline: Impressive CDD’s for U.S. and Europe.
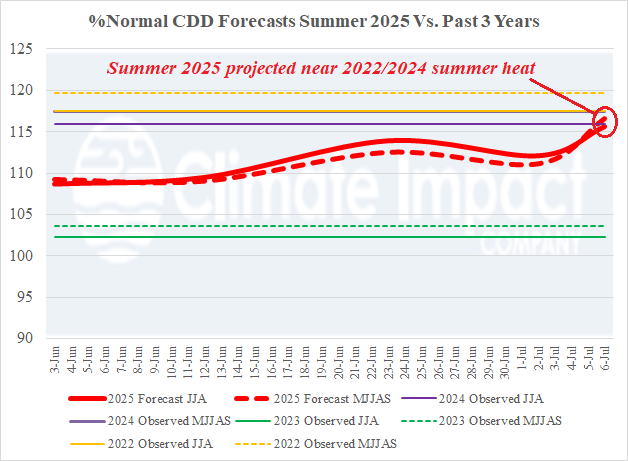
Fig. 1: The Climate Impact Company U.S. selected cities CDD forecast for JUN-AUG and MAY-SEP compared to the last 3 years versus the 30-year normal.
Discussion: The Climate Impact Company U.S. selected cities CDD forecast shifted hotter in this week’s update (Fig. 1) and is close to the 2022 and 2024 observations. Summer of 2022 ranked 3rd hottest on record for the U.S. while summer 2024 ranked 4th hottest. The observed summer 2025 CDD will rival the 2022 and 2024 heat primarily due to the anomalous heat observed in the PJM sector. The monthly CDD forecasts for July through September have increased by 8-26 CDD from the previous forecast (Table 1) and are above the warm 10-year climatology (Fig. 2). Additional hotter adjustments are possible! The impact on hotter CDD’s for mid-to-late summer is the vigorously hot influence of the PJM-East outlook (Fig. 3). In addition to the hot U.S. forecast, Europe has encountered their second hottest June on record as identified by the JUN-25 CDD count (Fig. 4). The projected mid-to-late summer Europe-West CDD (also) remain very hot.
| June | July | August | September | |
| 2025 | 265 | 376 | 339 | 203 |
| Observed/Previous Forecast | 263 | 368 | 324 | 177 |
| 10-year | 252 | 371 | 332 | 190 |
| 30-Year | 213 | 321 | 290 | 155 |
Table 1: The Climate Impact Company U.S. population weight CDD forecast for July through September, and the June verification compared to the 30-year and 10-year normal.
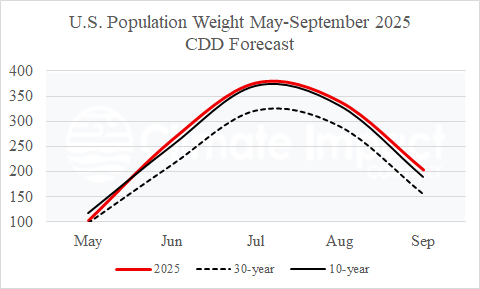
Fig 2: The Climate Impact Company U.S. population weight CDD forecast for the May to September warm season versus the 30-year/10-year normal.
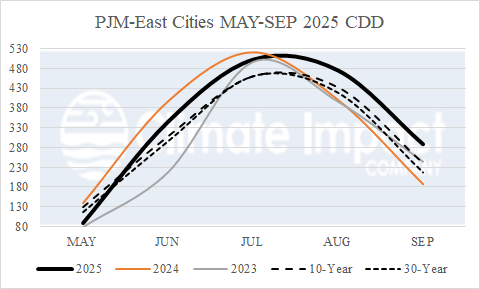
Fig. 3: The PJM-East Selected Cities May through September 2025 CDD forecast versus the past 2 years and 10-year/30-year normal.
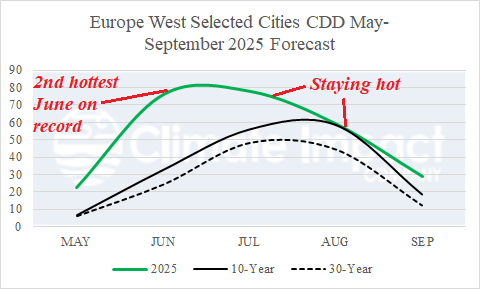
Fig. 4: The Europe-West selected cities CDD forecast for may through September 2025 compared to the 10-year/30-year normal.