
Subsurface Equatorial East Pacific Showing Signs of Cooling
07/21/2025, 1:36 pm EDT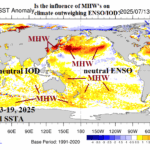
July 2025 Global Oceans Marine Heatwaves Update
07/25/2025, 8:43 am EDT
Climate Impact Company Early U.S. Notes
Issued: Thursday July 24, 2025
Highlight: Reorientating heatwave to become most intense over the Southeast U.S.; Frequent severe thunderstorm events across northern heatwave areas.
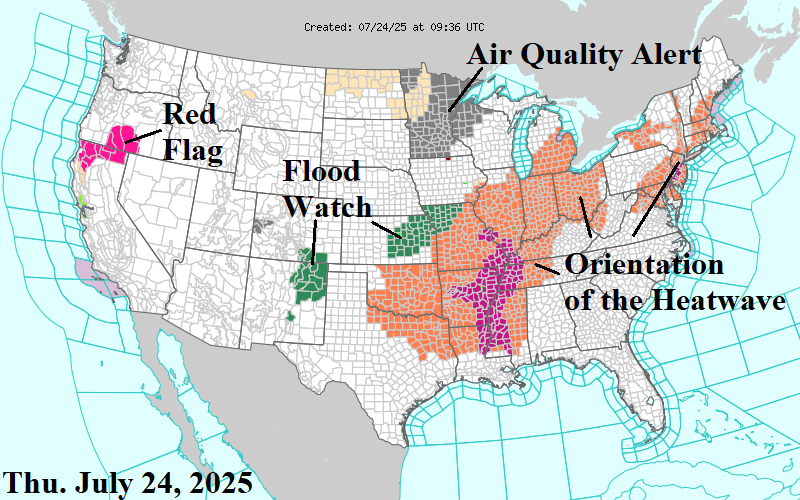
Fig. 1: NOAA/NWS weather watch, warning, and advisories.
Discussion: Heat Advisories extend from the Mid-south U.S. into the Northeast Corridor as the current heatwave reorientates eastward into the weekend (Fig. 1). The most intense heat remains over the central/south-central Mississippi River Valley. The hot weather is impressive through the weekend focused on the Ohio Valley today and Northeast/Mid-Atlantic tomorrow, but extreme alert-4 conditions for dangerous heat emerge Sunday and Monday (Fig. 2) in the Southeast U.S. On Tuesday and Wednesday of next week, extreme alert-4 conditions widen across the Southeast U.S. where this heatwave is most intense. Fortunately, the heat breaks in the 8-14-day period (Fig. 3). Severe thunderstorms are frequent, mostly on the northern fringe of the heatwave including Kansas to Michigan today, Iowa tomorrow, and the Northeast tomorrow and Sunday (Fig. 4). Heavy tropical rains associated with a tropical low-pressure off the northwest Gulf Coast should ease by early weekend. The U.S. population weight CDD forecast through late July is unchanged from yesterday maintaining next week’s heat spike and followed by a 4-6-week outlook indicating lowered potential for extreme heat repeats (Fig. 5).

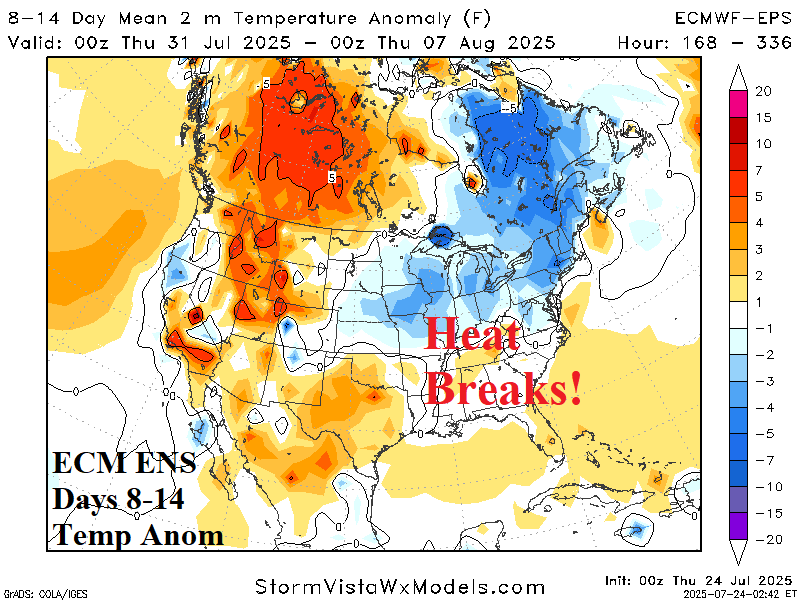
Fig. 2-3: The most intense part of the current heatwave emerges early next week in the Southeast U.S. and breaks during the 8-14-day period.

Fig. 4: The NOAA/WPC 5-day quantitative precipitation forecast.
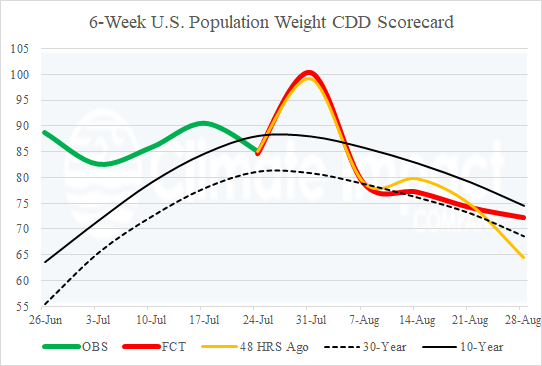
Fig. 5: U.S. population weight CDD forecasts through the next 6 weeks.