Atlantic Upper Ocean Heat is Becoming Less Impressive
06/12/2024, 11:13 am EDTTrouble Brewing In The Western Gulf of Mexico
06/16/2024, 9:14 am EDT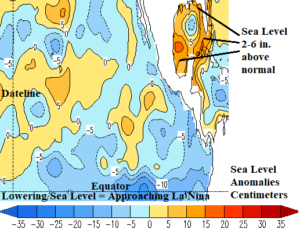
Fig. 1: Sea level height anomalies (in centimeters).
Discussion: The warmer than normal subtropical/tropical North Atlantic SSTA pattern is well-established, frequently discussed, and a leading catalyst of the expected buoyant hurricane season ahead. However, the warmer than normal SSTA regime has considerably more influence on climate than increased risk of stronger tropical cyclones. First, warmer than normal SSTA across a large area indicates the lower atmosphere has increased precipitable water evaporated into tropical or conventional storms vastly increasing rainfall amount. An example of this dynamic is taking place in South Florida now. Second, vast warm SSTA indicates expanding volume of water therefore sea level rise. A conservative projection of sea level height anomalies across the Gulf of Mexico now is in the 2-6-inch range (Fig. 1). When tropical cyclones pass across the higher sea level, the wedge of water pushed inland by a storm surge is considerably higher.
The morning 7-day QPF from NOAA/WPC indicates the extreme rains across Southern Florida shift westward with axis of heaviest rain farther south although the north/west fringe of heavy rain reaches the Gulf Coast (Fig. 2). The southern shift of extreme rain is due to increasing tropical cyclone risk in the southwest Gulf of Mexico especially early-to-middle of next week.
The 12Z GFS stays hot in the Northeast in the 6-10-day period (Fig. 3) shifting somewhat cooler in the 11-15-day period (Fig. 4). A +NAO pattern during the 11-15-day period implies the warmth in the East is likely to continue and the cooler solution is discarded.
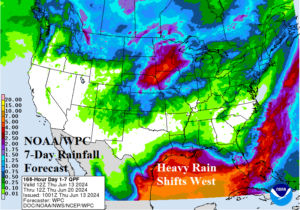
Fig. 2: The NOAA/WPC 7-day QPF projection.
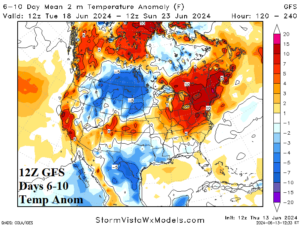
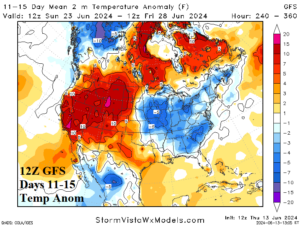
Fig. 3-4: The 12Z GFS medium-range temperature anomaly forecast.
| CDD EIA End Date | Forecast | 12-Hour Change | 24-Hour Change | 30-Year Normal | 10-Year Normal |
| 6/13 | 54.7 | -0.3 | -0.2 | 51.3 | 55.6 |
| 6/20 | 79.4 | +1.4 | +0.8 | 58.8 | 63.3 |
| 6/27 | 83.5 | -4.6 | -2.3 | 66.4 | 71.1 |
Table 1: The 12Z GFS U.S. population weight CDD forecast compared to 12 and 24 hours ago.