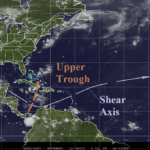
Tropical Upper Tropospheric Trough Forms
07/08/2025, 9:15 am EDT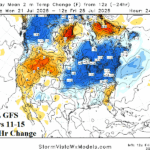
12Z GFS Much Cooler Midwest to Northeast in Medium Range
07/11/2025, 1:28 pm EDT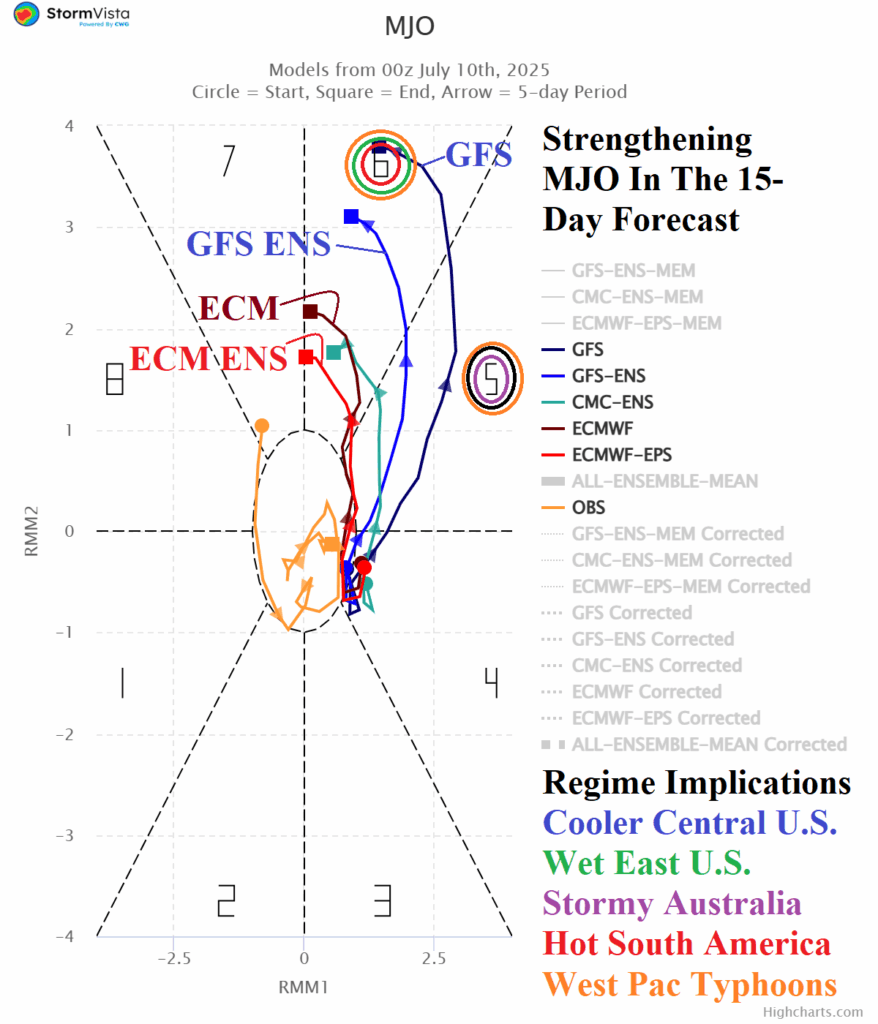

Climate Impact Company Madden Julian Oscillation Outlook
Issued: Thursday, July 10, 2025
Highlight: Potent Phase_5/Phase_6 of the MJO is ahead!
Fig. 1: The MJO 2-week forecast indicates an evolving and strengthening phase_5/phase_6 regime.
Discussion: The Madden Julian oscillation (MJO) activates and intensifies across the tropical West Pacific to the Dateline (phase_5/phase_6) during the next 2 weeks (Fig. 1). The GFS forecast is strongest and indicates prohibitive intensity. Potential effects on global weather include the activation of a potentially very active tropical cyclone regime in the West Pacific (Fig. 2). At least one major typhoon is likely with implications for Japan or China (if a west turn occurs). In the U.S., the GFS is alone forecasting exceptionally cool medium-range temperatures into the Central U.S. which MJO phase_6 supports (Fig. 3). Storminess followed by chilly weather is indicated by MJO support for Australia weather (Fig. 4). In South America, the strengthening MJO supports very warm weather during the next 10+ days (Fig. 5).
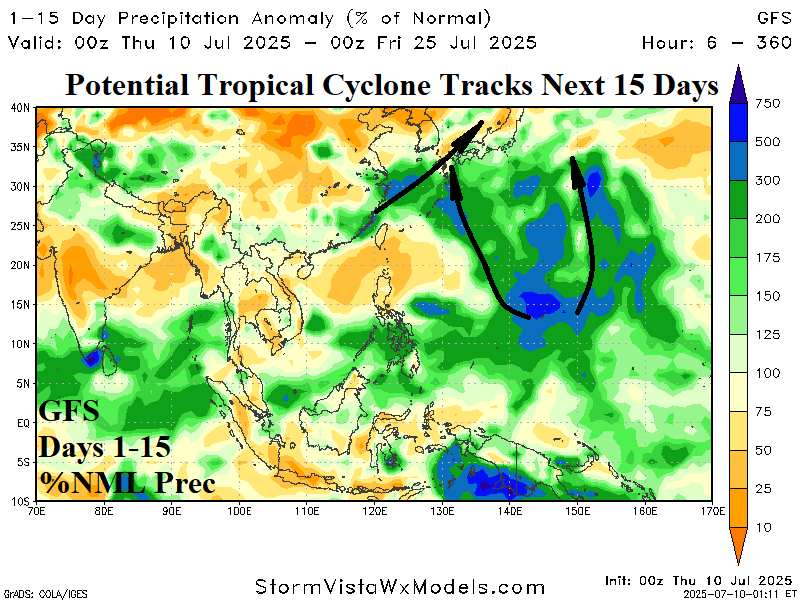
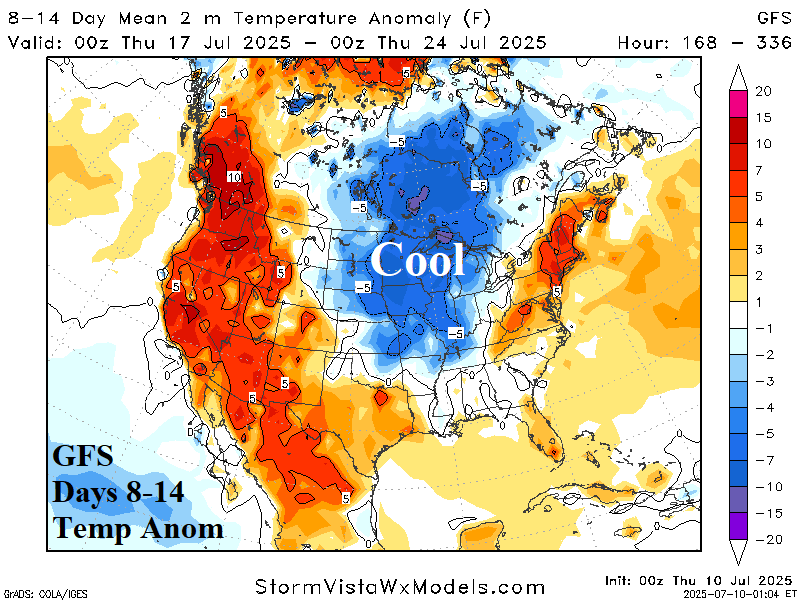
Fig. 2-3: The GFS 15-day percent of normal rainfall across the West Pacific and GFS 8-14-day U.S. temperature anomaly forecast.
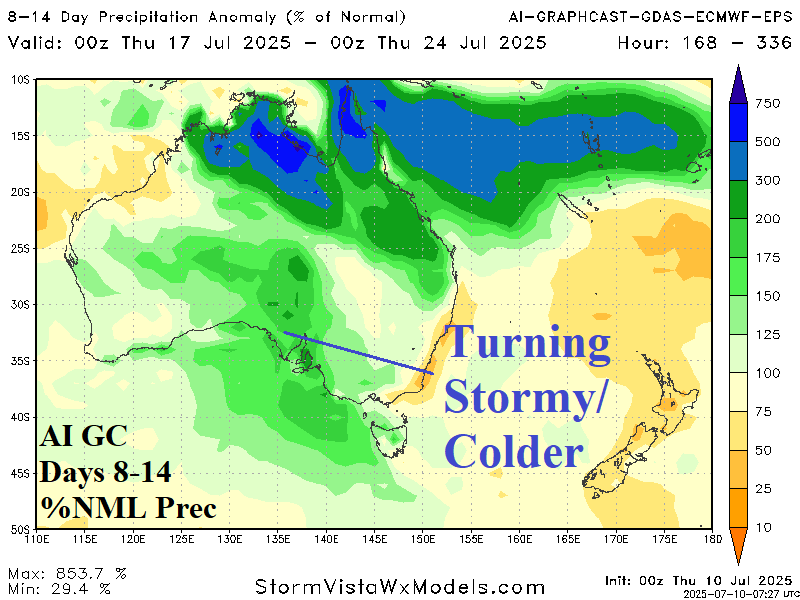
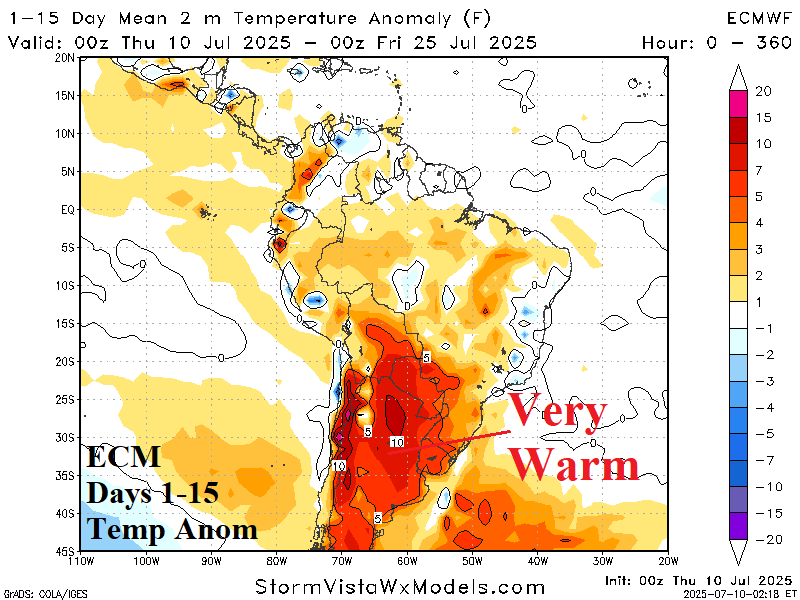
Fig. 4-5: The AI Graph Cast 8-14-day percent of normal precipitation forecast across Australia and ECM 15-day temperature anomaly projection for South America.