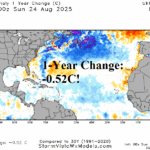
North Atlantic Basin Regions of SSTA Analysis
08/25/2025, 10:22 am EDT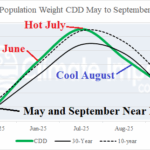
U.S. CDD’s Crash in August!
09/01/2025, 9:10 am EDT
![]()
Climate Impact Company Daily Feature
Issued: Thursday, August 28, 2025
Highlight: The northern hemisphere upper air pattern changes in September.
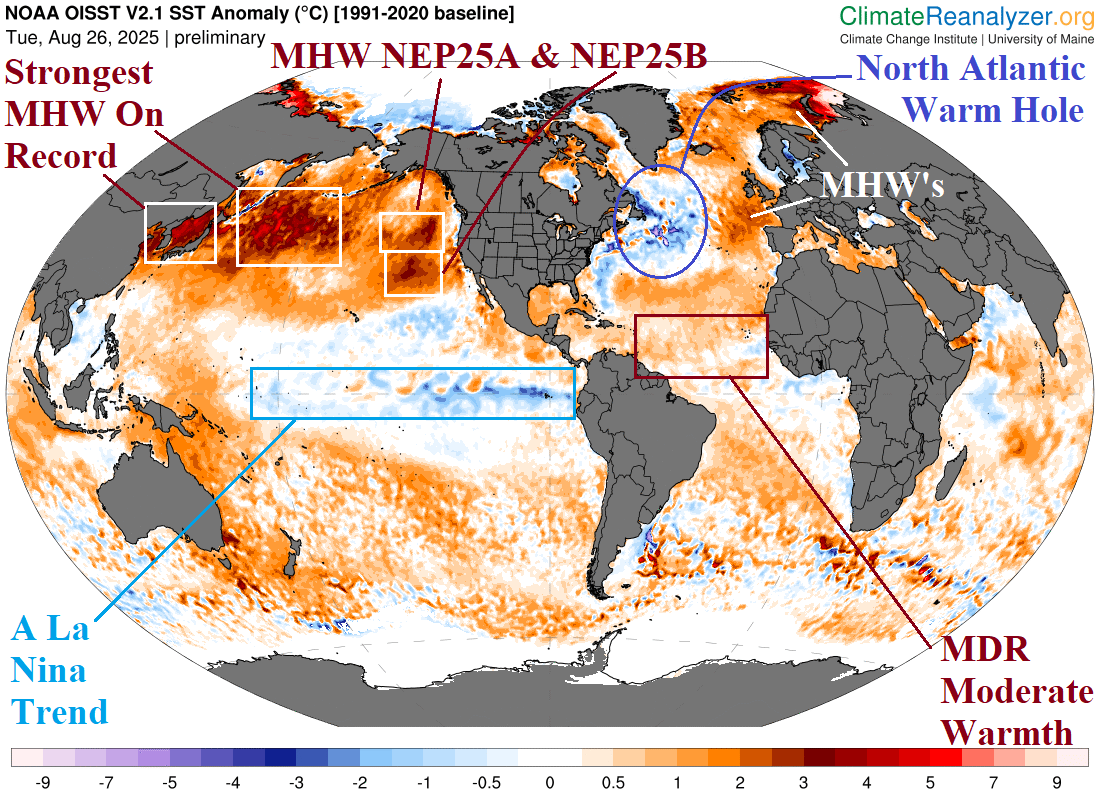
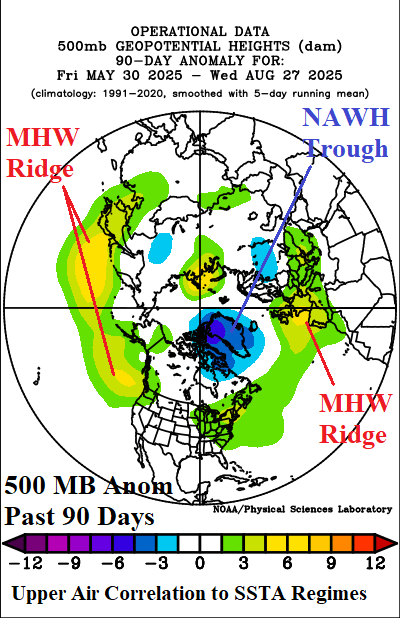
Fig. 1-2: The global SSTA analysis from University of Maine and the NCDC/PSD 90-day 500 MB anomaly analysis for summer 2025 (so far).
Discussion: The strongest marine heat waves (MHW) on record in the West Pacific and in-between Japan and the Asia Coast extending to MHW’s NEP25A and NEP25B in the Northeast Pacific (Fig. 1) are well-correlated to the summer 2025 upper air pattern featuring a strong upper-level high-pressure ridge (Fig. 2). Similarly, the MHW’s in the east/northeast portion of the North Atlantic are well-correlated to a semi-permanent upper-level high-pressure ridge dominating the west/south portion of Europe during summer 2025. Equally impressive is the compensating upper trough centered on Greenland and westward during summer 2025 near and just north of the North Atlantic Warm Hole (NAWH). The prevailing pattern is forecast to change in September, likely due to seasonality and a possible significant uptick in tropical cyclone activity.
The 1-15-day northern hemisphere 500 MB anomaly forecast by the high-skill AIFS ENS indicates the NAWH low pressure system shifts northward toward the North Pole (Fig. 3). The northward shift allows a subtropical ridge to strengthen northeast of the Bahamas suggesting the recently cooling waters due to Erin will rewarm. The increasing westerlies south of the North Pole trough push the Europe ridge farther inland. The MHW-induced high pressure area east of Asia persists.
In the extended-range, days 16-30, AIFS V2 4CastNet V2 ECM ENS and ECM are similar with upper air features (although AI is stronger) projecting northern latitude high pressure ridge areas over Canada, Northern Europe, and near the Aleutian Islands while pressure lowers in the subtropics (Fig. 4-5). Northeast Asia cools while the subtropical ridge over locates over China.
Summary: The September 2025 northern hemisphere pattern changes. Northern latitude anomalous warmth beneath high pressure increases and lowering pressure in the subtropics fuels a significant uptick in tropical cyclone activity.
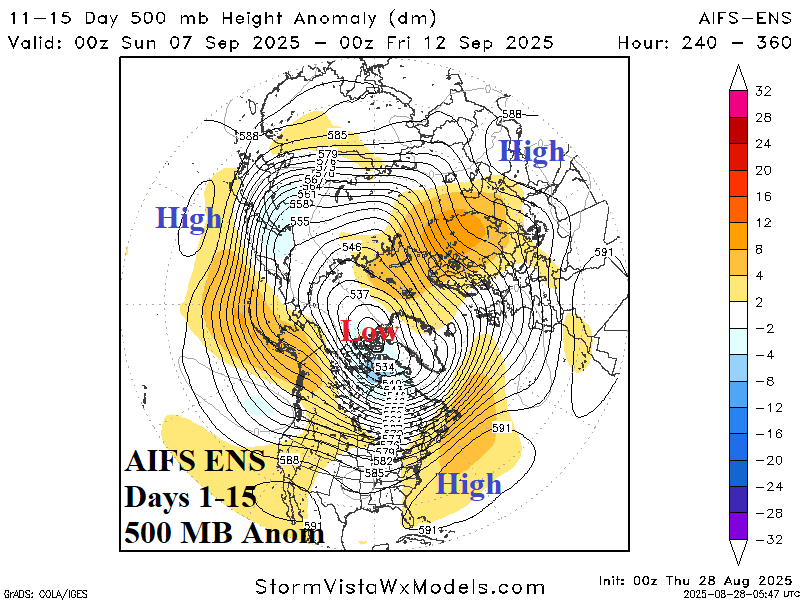
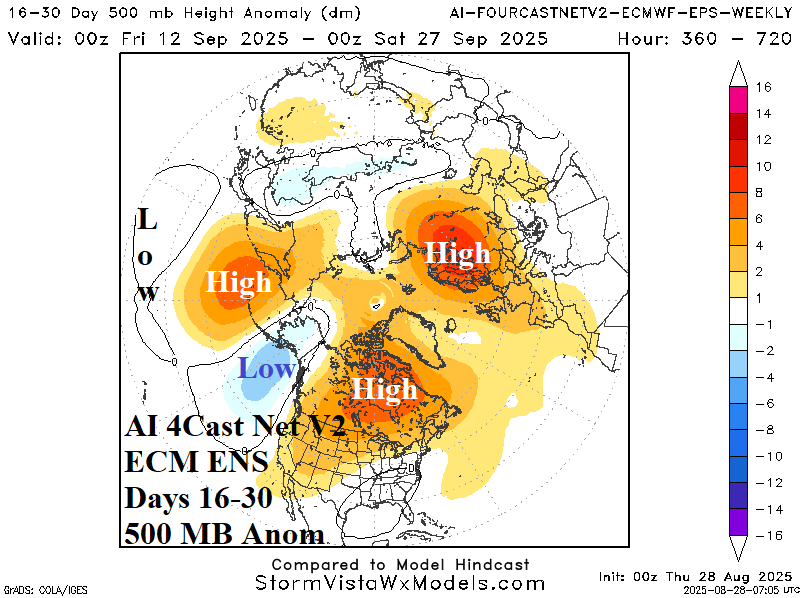
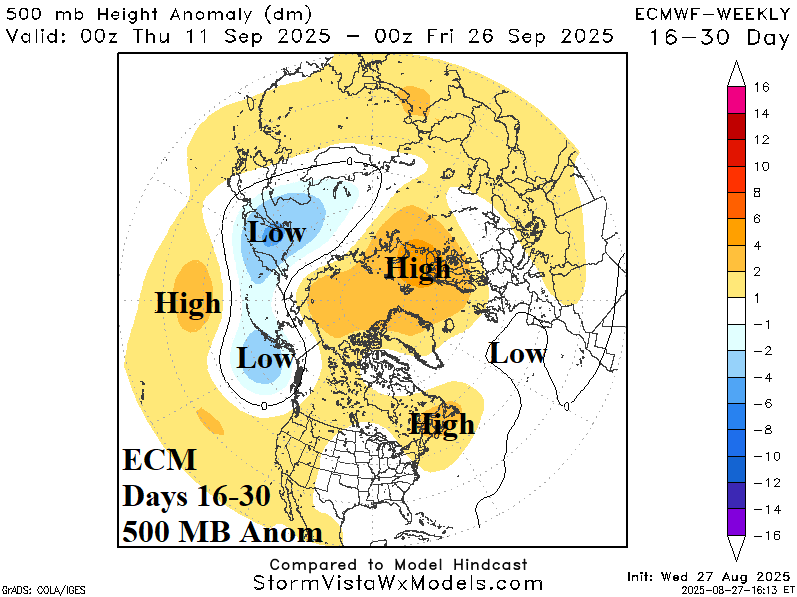
Fig. 3-5: The AIFS ENS 1-15-day northern hemisphere 500 MB anomaly pattern and a comparison for days 16-30 between AI 4CastNet V2 ECM ENS and ECM.