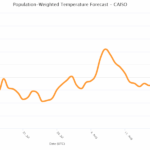
Hottest Event of Summer 2025 in California
08/20/2025, 6:43 am EDT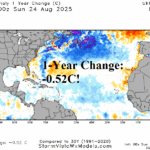
North Atlantic Basin Regions of SSTA Analysis
08/25/2025, 10:22 am EDT
Climate Impact Company Month 1-6 Outlook
Australia
Issued: Friday, August 22, 2025
Wet/cool spring followed by summer heat/dryness East Australia
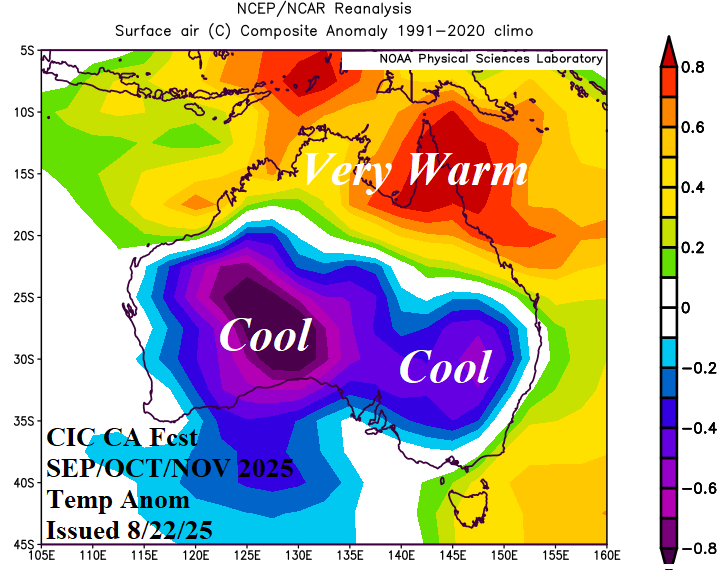
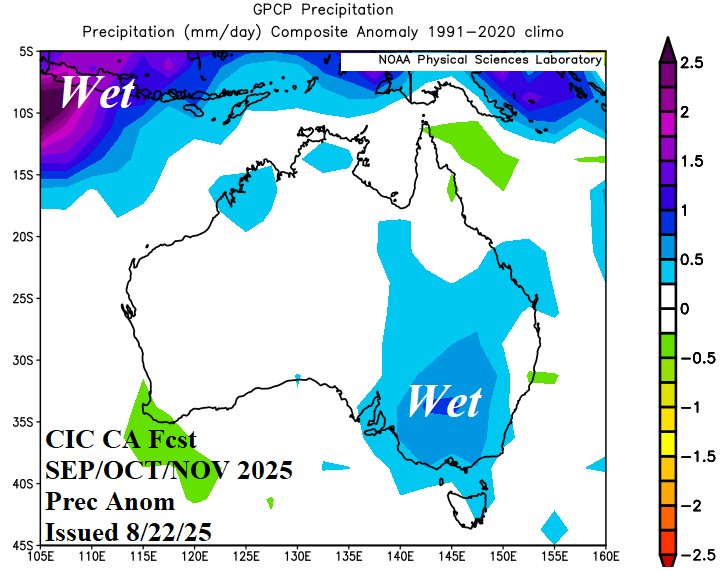
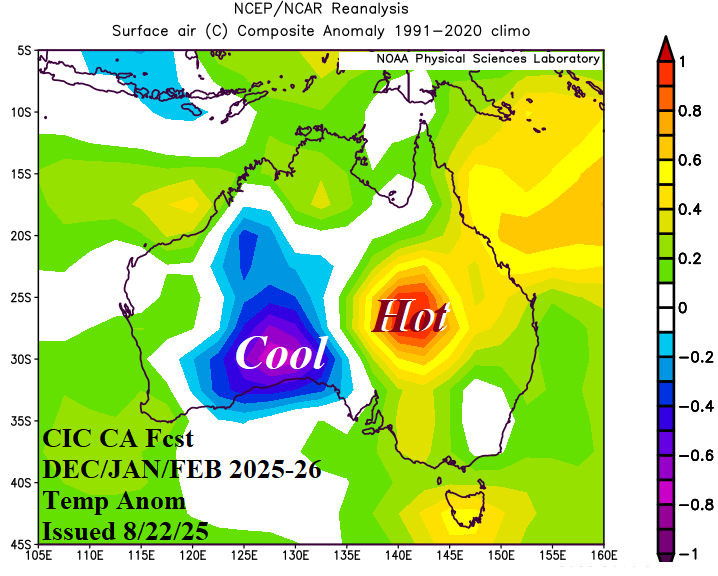
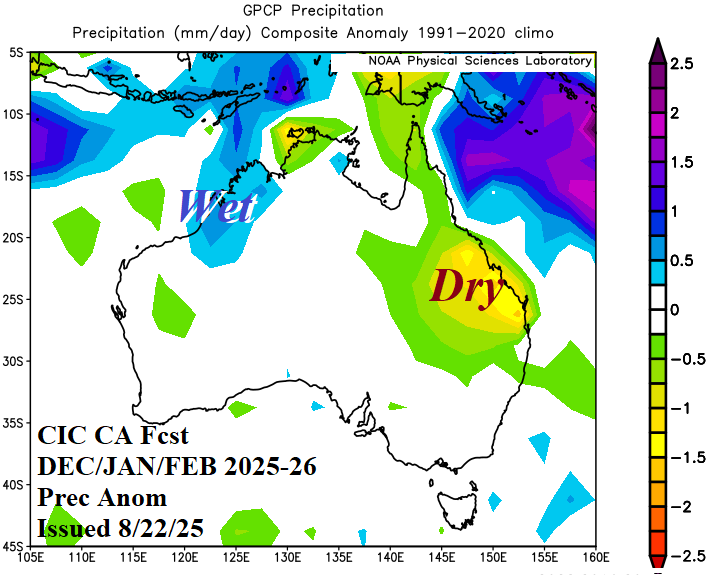
Fig. 1-4: The Climate Impact Co. constructed analog temperature & precipitation anomaly forecast for SEP/OCT/NOV 2025 and DEC/JAN/FEB 2025-26.
Executive Summary: The Climate Impact Company constructed analog climate outlooks for meteorological spring 2025 and winter 2025-26 is issued. The spring season is mostly cooler than normal across much of the continent with a wet bias in the East. The summer outlook reverses drier and hotter in the East. Current soil conditions across Australia reveal drought in the West and wet soils across the North and East. The current pattern changes little during spring except drying soils across the North. However, drying is likely to eliminate wet soil in the East during summertime. There is risk of developing drought in the East mid-to-late summer.
Climate discussion: Currently, the SSTA pattern surrounding Australia vividly depicts large and intense marine heatwaves (MHW) intensifying to the northeast holding steady to the southeast (Fig. 5). Additionally, negative phase of the Indian Ocean dipole (-IOD) is developing while ENSO is neutral although recently showing some La Nina tendencies in the Nino34 SSTA region and eastern equatorial Pacific subsurface.
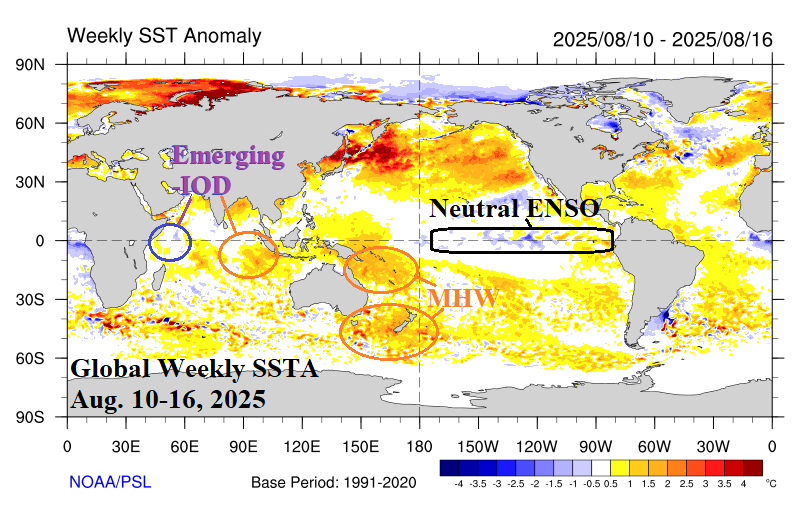
Fig. 5: The most recent weekly global SSTA analysis from NOAA and regions of influence on Australian climate.
As a reminder, MHW’s have been dominant, especially east of Australia, during the past 10 years. More recently, waters west of Australia have produced semi-permanent MHW’s while east of Australia, MHW’s have strengthened. The influence of MHW’s on the Australia upper air pattern is to produce a semi-permanent amplified upper-level high-pressure ridge area either side of the continent and an in-between weak trough centered on the South Coast (Fig. 6). The upper trough has caused the 10-year precipitation pattern across Australia to bias wet in the East (Fig. 7) with the wet anomaly strengthening in this decade (Fig. 8). The rainfall caused by the upper trough is frequently enhanced due to the warmer than normal waters off the East Coast raising low-atmosphere moisture causing evaporation rates to increase and attendant rainfall to overachieve.
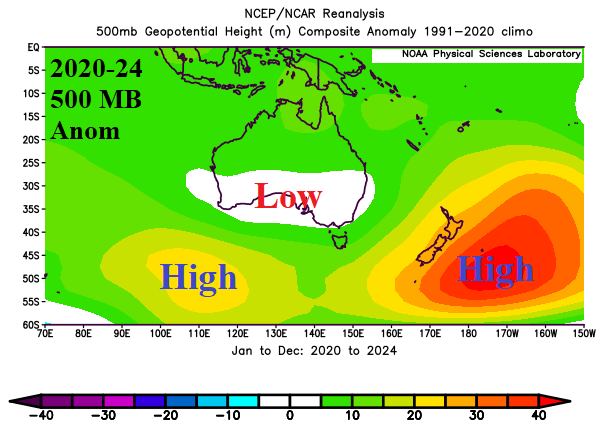
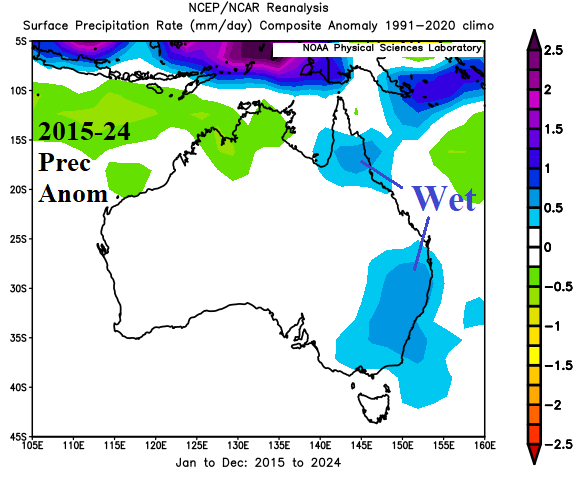
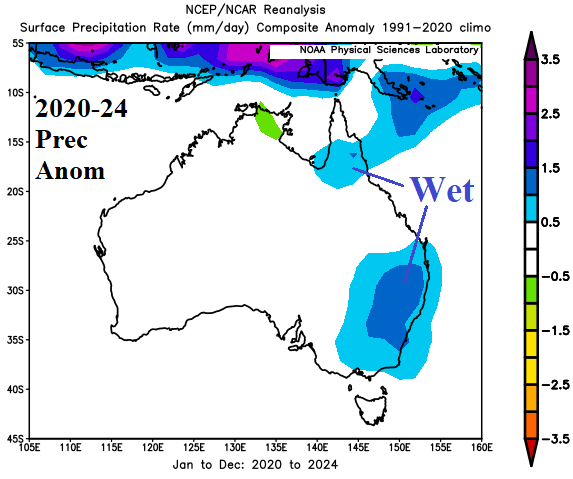
Fig. 6-8: The prevailing 500 MB anomaly pattern across Australia in this decade and the 2015-24 plus 2020-24 Australia rainfall anomalies.
The global SSTA forecast centered on Q4/2025 is used to project prevailing climate across Australia in the month 1-6 ahead outlook. Utilized is the International Multi-Model Ensemble (IMME) model which indicates presence of a weak La Nina, a moderately strong -IOD regime, and strong MHW’s northeast to southeast of Australia (Fig. 9). Waters west of Australia are not as (anomalous) warm. Weak La Nina and -IOD should end mid-to-late Q1/2026 while MHW’s persist. Implied is the leading oceanic influence on prevailing climate is the marginal warm influence of SSTA west of Australia vs. strong anomalous warmth east of Australia (instead of ENSO and IOD).
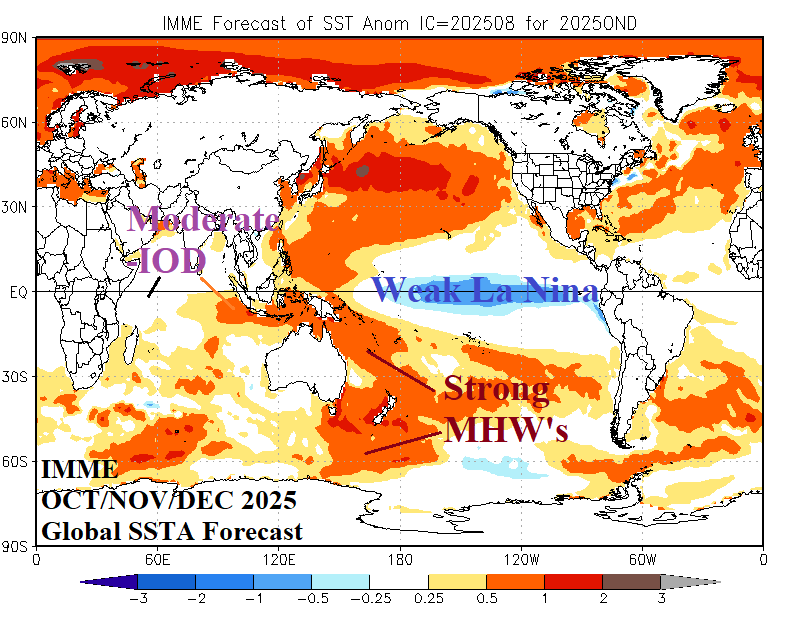
Fig. 9: The IMME global SSTA forecast for OCT/NOV/DEC 2025.
The GRACE-based Australia soil moisture anomaly analysis indicates widespread wet soils across the north, east-central, and east-coastal continent (Fig. 10). Drought is prominent across Western Australia with marginal dryness on the southeast coast. Large areas of dry (hotter) and wet (suppressed heat) soil moisture conditions can affect the prevailing summer climate.
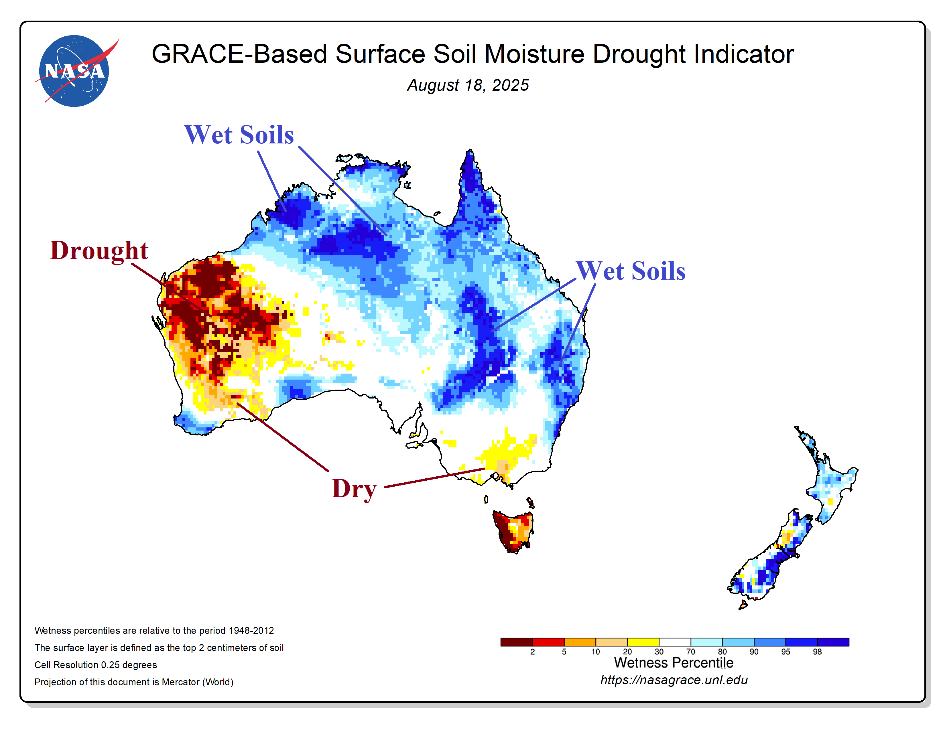
Fig. 10: The GRACE-based Australia soil moisture anomalies analysis for August 18, 2025.
September 2025: A broad upper-level low-pressure trough is semi-permanent over west-central continent. This feature is the catalyst for a rainy early spring across East Australia. Significant rain is possible over New South Wales. The month of September is cooler than normal across the southern half of the continent and somewhat warmer than normal on the North Coast.
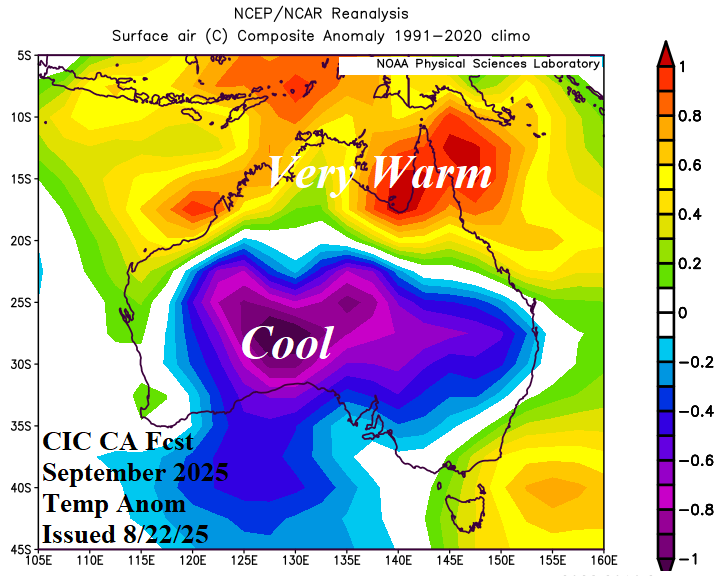
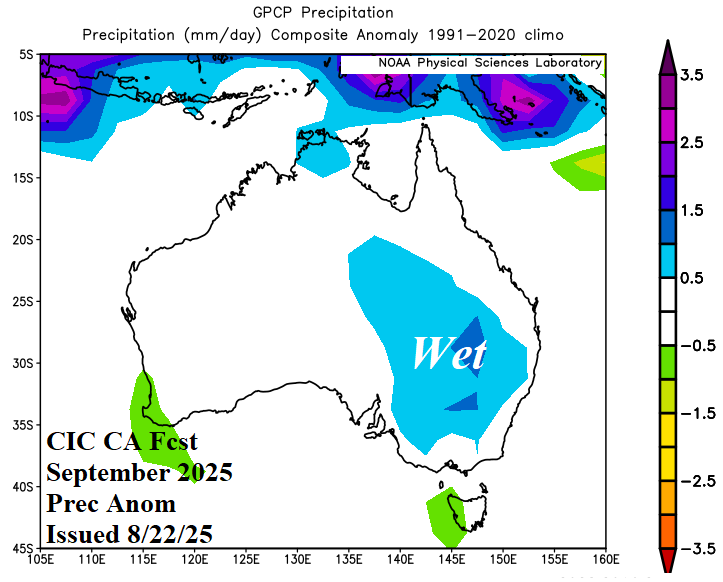
Fig. 11-12: The Climate Impact Company constructed analog temperature and precipitation anomaly forecast for September 2025.
October 2025: Mid-spring brings a potent upper-level low-pressure trough presence to the South Coast. The sensible weather averages cooler than normal across much of Australia except warmer than normal in Queensland. Southeast Australia is potentially very wet.

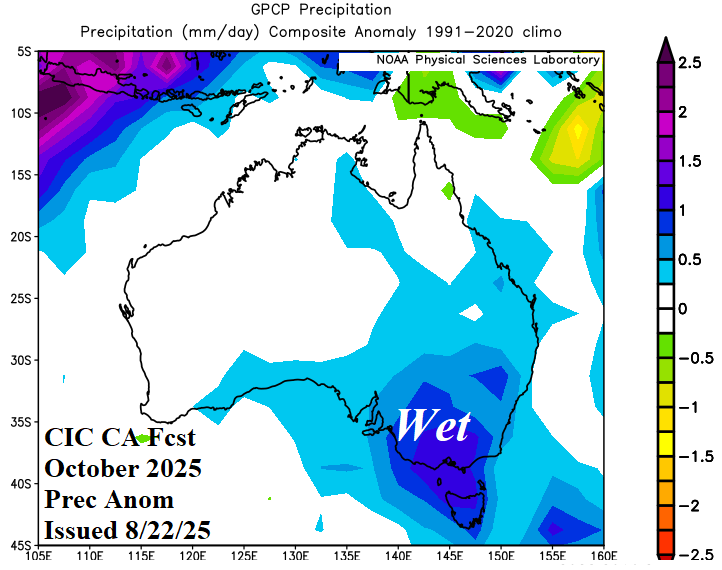
Fig. 13-14: The Climate Impact Company constructed analog temperature and precipitation anomaly forecast for October 2025.
November 2025: The tendency for springtime upper troughs continues. During late spring, the upper trough shifts to southeastern continent. The cool pattern across much of Australia continues except hotter than normal for the North Coast and much of Queensland. The tendency for much above normal rainfall risk in the East eases.
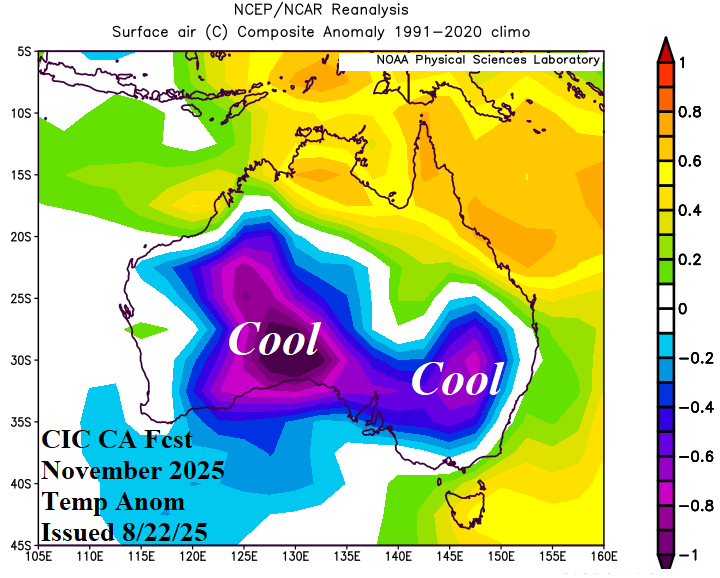
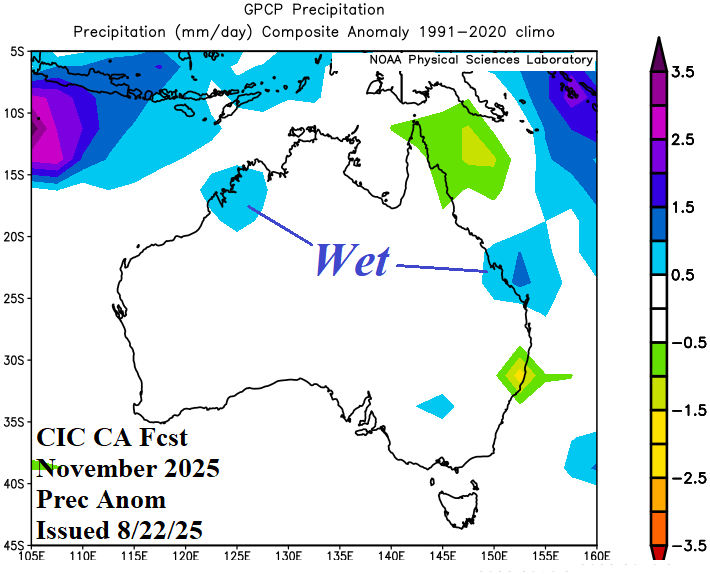
Fig. 15-16: The Climate Impact Company constructed analog temperature and precipitation anomaly forecast for November 2025.
December 2025: As meteorological summer arrives, the tendency for upper troughs common during springtime, fades. An upper-level high-pressure ridge associated with the MHW pattern east of Australia emerges and causes a hot early summer pattern across eastern continent with emerging dryness in Southeast Queensland. Wet weather risk shifts to the northwest coast.
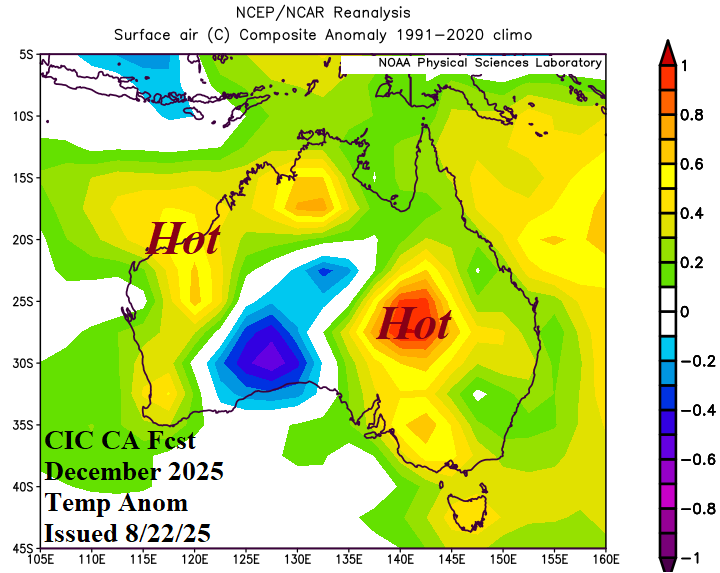
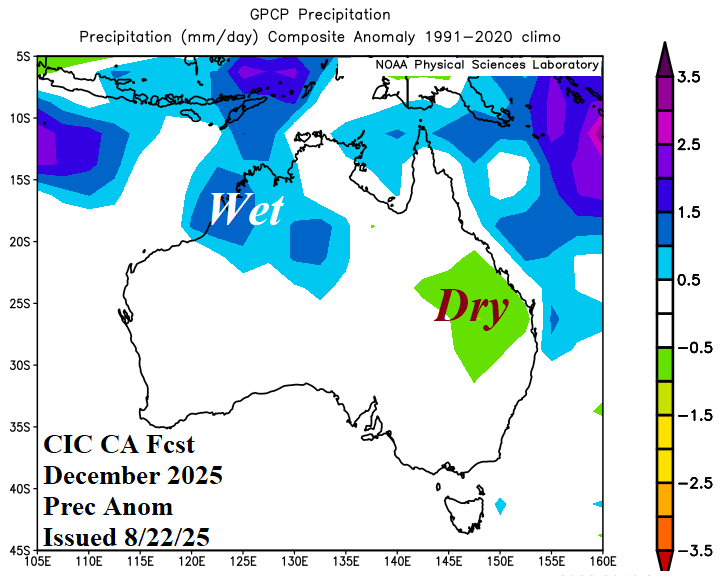
Fig. 17-18: The Climate Impact Company constructed analog temperature and precipitation anomaly forecast for December 2025.
January 2026: During mid-summer, a weak upper trough is projected over western continent while an upper ridge anchors in the East. The sensible mid-summer climate favors anomalous heat and dryness in the East while the West is wet and less hot than normal. Tropical rains are likely to bring excessive rain to northwest continent and the northern coast of Queensland.
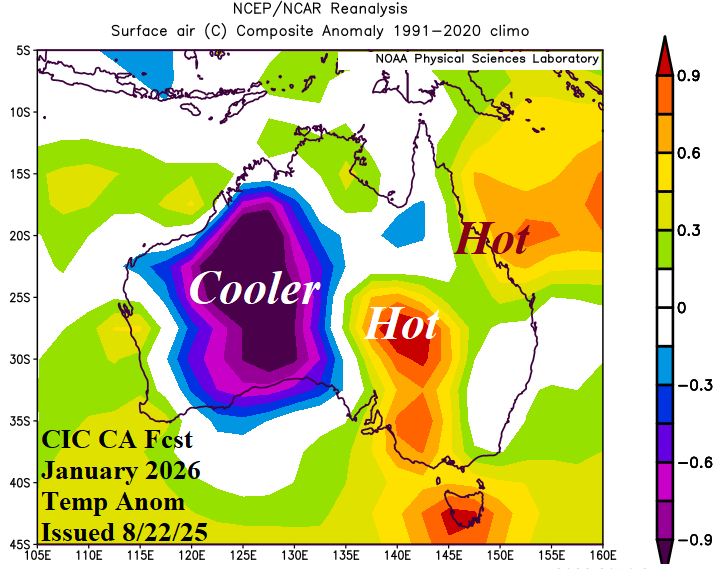
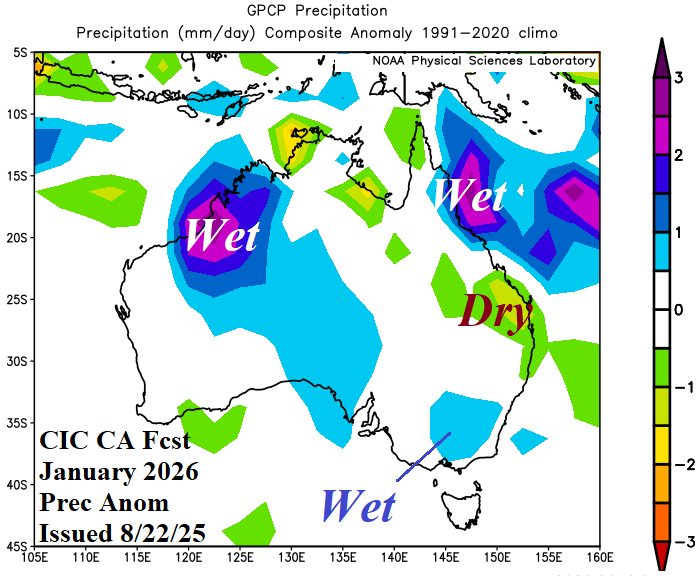
Fig. 19-20: The Climate Impact Company constructed analog temperature and precipitation anomaly forecast for January 2026.
February 2026: Late meteorological summer is hotter and drier than normal across much of Australia. The exception is cooler than normal along the South Coast.
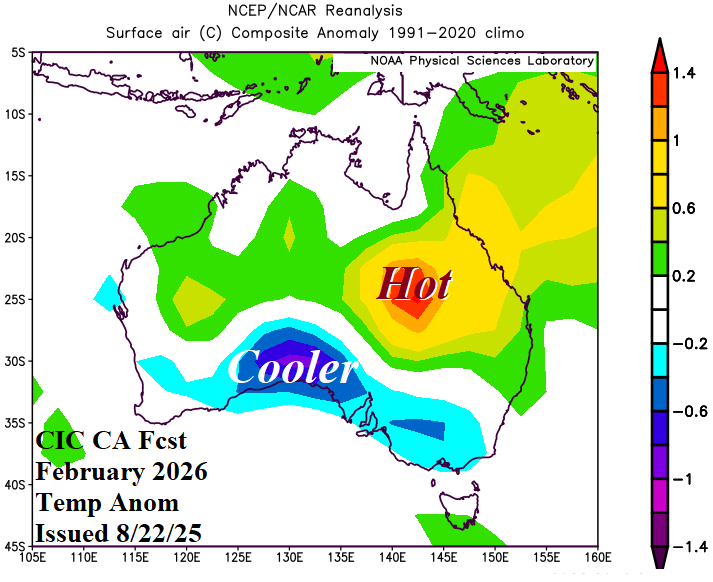
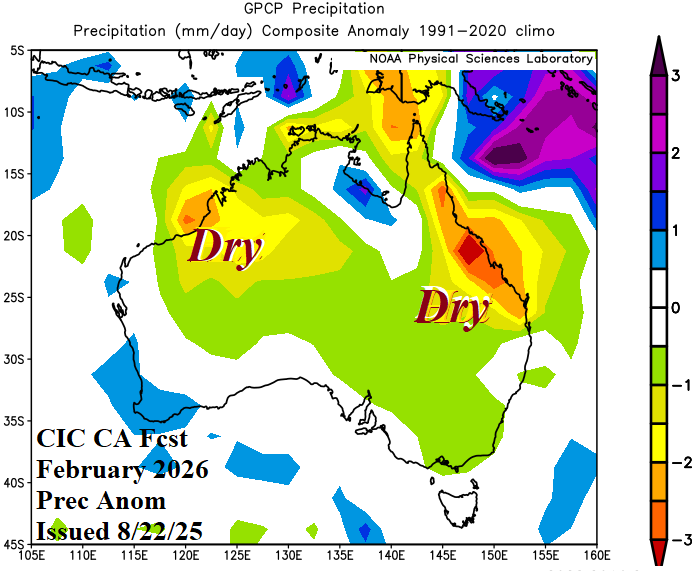
Fig. 21-22: The Climate Impact Company constructed analog temperature and precipitation anomaly forecast for February 2026.