Explaining The U.S. Summertime Warm Bias in U.S. Medium-range Forecasts
08/25/2024, 11:48 am EDTStrengthening MJO/SOI Causal to Sudden La Nina Trend
08/28/2024, 5:15 am EDTHighlight: Low activity so far, but a major uptick for SEP/OCT/NOV remains in the forecast.
Executive summary: The North Atlantic basin tropical cyclone season has been normally active to date and somewhat below the expectation based on previous seasonal activity projections. Primary catalysts to the lower-than-expected seasonal activity to date are faster than normal trade winds allowing Saharan Dust to extend across the tropical North Atlantic and sudden cooling of the surface water and upper ocean heat near the equator. The second half of the tropical cyclone season projects improving conditions and maintains very favorable conditions over the western North Atlantic tropics where buoyant upper ocean heat exists. A La Nina climate is developing which lowers upper westerly shear. The SEP/OCT/NOV 2024 tropical cyclone activity forecast projects a still dangerous total of 12 storms, 8 hurricanes, and 5 intense hurricanes with an ACE index of 168. The activity forecast for the second half of the season is about 137% of the 30-year normal. Using the ECMWF probabilistic forecast for tropical cyclone location for SEP/OCT/NOV 2024, the western North Atlantic basin is strongly favored leaving the U.S. Coast at continued above normal risk of impacts.
Climate discussion: So far, the North Atlantic tropical cyclone season has produced 5 tropical storms, 3 hurricanes, and 1 major hurricane with an accumulated cyclone energy (ACE) index of 55.1 (Table 1). The values are close to normal for late August although the ACE index is twice the normal value. The East Pacific has been more active than the North Atlantic including unusual presence of tropical cyclone reaching Hawaiian waters with 9 tropical storms, 3 hurricanes, and 1 major hurricane and ACE index of 45.9. However, the late August East Pacific tropical cyclone activity is also below normal.
| Tropical Storms | Hurricanes | Intense Hurricanes | ACE Index | |
| North Atlantic | 5 | 3 | 1 | 55.1 |
| Normal 8/27 | 5.7 | 2.1 | 0.6 | 26.7 |
| East Pacific | 9 | 3 | 1 | 45.9 |
| Normal 8/27 | 9.4 | 4.8 | 2.5 | 72.8 |
Table 1: North Atlantic and East Pacific tropical cyclone activity through August 26, 2024, compared to late August 30-year normal.
The North Atlantic basin seasonal tropical cyclone forecasts were revised higher during early August by all leading forecast providers (Table 2). The reasons sighted were historic upper ocean heat and light wind shear aloft due to an expected La Nina development.
| Tropical Storms | Hurricanes | Intense Hurricanes | ACE Index | |
| Climate Impact | 23 | 12 | 6 | 240 |
| Colorado State | 23 | 12 | 6 | 230 |
| T. S. Risk/U.K. | 24 | 12 | 6 | 230 |
| NOAA/ NHC | 17-25 | 8-13 | 4-7 | N/A |
Table 2: The current operational seasonal tropical cyclone season activity level projections from Climate Impact Company, Colorado State University, Tropical Storm Risk U.K., and NOAA/NHC.
Currently, operational models indicate no tropical cyclone development through the first few days of September. Consequently, the Sep. 4 through Nov. 30 time interval is required to produce about 18-19 storms, 9 hurricanes, and 5 intense hurricanes for a perfect verification of the seasonal outlooks. The normal tropical cyclone activity for that time interval is about 10 storms, 5 hurricanes, and 2-3 intense hurricanes. The most active year on record for SEP/OCT/NOV activity is 2005 and 2020 when 15-16 storms, 9-10 hurricanes, and 4-6 intense hurricanes occurred. The midpoint of the season is around Sep. 10th.
The explanation for why seasonal activity for JUN/JUL/AUG 2024 is below expectations is twofold. First, an unusual amount of Saharan Dust has poured into the North Atlantic basin tropics/subtropics caused by stronger than normal trade winds (Fig. 1). Second, the sea surface temperatures in the deep tropics (and upper ocean) have cooled significantly during summertime (Fig. 2).
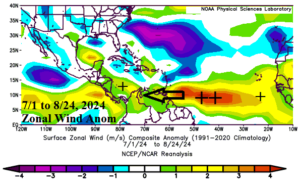
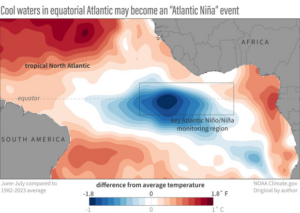
Fig. 1-2: The zonal wind speed anomalies across the tropical North Atlantic for July 1 to August 24, 2024, identifies much faster than normal trade winds while the Cooperative Institute for Marine and Atmospheric Studies (CIMAS) observes much cooler equatorial Atlantic waters for JUN/JUL 2024.
While ENSO remains neutral, the multivariate ENSO index (MEI) for JUN/JUL was -0.7 which suggests a La Nina climate is developing. Recently, the southern oscillation index (SOI) shifted to a strong positive phase which is ongoing into early September (Fig. 3) and a strong climate diagnostic to suggest a La Nina climate is beginning to strengthen. Oceanic La Nina has lagged and may wait until late in the tropical cyclone season to develop.
The deep tropical SST is beginning to warm again although upper ocean heat favoring North Atlantic tropical cyclone activity remains biased toward the western half of the basin (Fig. 4). The Saharan Dust is less intrusive although still a problem in the eastern tropics/subtropics (Fig. 5).
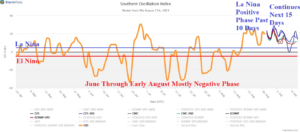
Fig. 3: The southern oscillation index identifies the (ENSO) tropical climate. Most of summer has observed an El Nino-like negative SOI. However, SOI has shifted to La Nina-like positive phase and is forecast to stay positive.
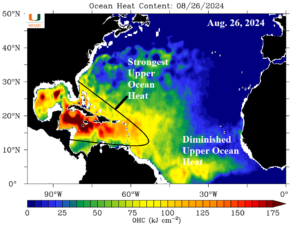
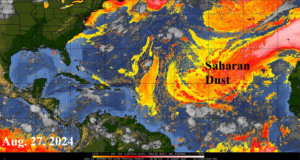
Fig. 4-5: Strongest upper ocean heat is on the western side of the North Atlantic basin while Saharan Dust is still intrusive to the eastern North Atlantic basin.
The second half of the season tropical cyclone outlook is based on a developing weak La Nina climate as implied by MEI and sustained by the apparent change in the SOI regime plus still very warm SSTA across the western half of the North Atlantic basin. Two obvious analogs identified are 2017 and 2020. Each year, MEI shifted to negative phase and the upper ocean heat in the tropical/subtropical North Atlantic was buoyant across the west-to-central basin. The SEP/OCT/NOV tropical cyclone activity in 2020 was (along with 2005) the most active on record, which could still happen. The 2017 analog, used in previous outlooks, was closer to normal activity. The consensus of near normal to record active is a good split for a remainder of 2024 seasonal activity forecast which is produced with 2.5 to 3.0 confidence on a 1-5 scale.
The revised FINAL forecast for the 2024 season is 17 tropical storms, 11 hurricanes, and 5 intense hurricanes with an ACE index of 227.1 (Table 3). To attain these values, the second half of the 2024 season is very active, and averages about 37% above normal.
| Year | Tropical Storms | Hurricanes | Intense Hurricanes | ACE Index |
| 2020 | 15 | 9 | 6 | 134.9 |
| 2017 | 8 | 6 | 4 | 201.1 |
| Average | 11.5 | 7.5 | 5.0 | 168.0 |
| Forecast | 12 | 8 | 5 | 168.0 |
| 2024 So Far | 5 | 3 | 1 | 59.1 |
| Previous 8/6 | 23 | 12 | 6 | 240 |
| FINAL | 17 | 11 | 6 | 227.1 |
| 5-Year NML | 20.6 | 8.2 | 3.6 | 139.8 |
| 15-Year NML | 16.9 | 7.6 | 3.4 | 132.8 |
| 30-Year NML | 15.5 | 7.5 | 3.4 | 130.4 |
| T.S.R./UK | 24 | 12 | 6 | 230 |
| C.S. U. | 23 | 12 | 6 | 230 |
Table 3: The ADJUSTED FINAL CIC-CA North Atlantic basin 2024 seasonal tropical cyclone activity forecast.
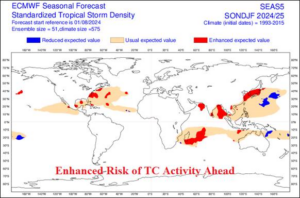
Fig. 6: ECMWF probabilistic projection of active tropical cyclone areas over the next 6 months with North Atlantic risk centered on SEP/OCT/NOV.
Given the favorable western North Atlantic basin for tropical cyclone development, the probabilistic forecast of tropical cyclone location by ECMWF is used to project the most likely threat areas for the SEP/OCT/NOV 2024 forecast (Fig. 6). Of concern is the higher risk areas very close to the U.S. East Coast particularly the Mid-Atlantic region. One saving grace could be the recent cooling of ocean waters off the U.S. East Coast (Fig. 7) although rewarming has initiated in recent days. The Gulf of Mexico and Caribbean Sea remain extremely warm compared to normal.
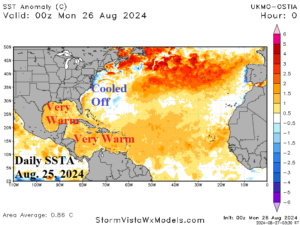
Fig. 7: The North Atlantic basin daily SSTA observations for Aug. 25, 2024.