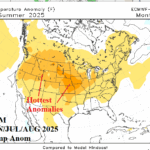
ECMWF “Monthlies” Forecast Hot/Dry Summer for Great Plains and Central Europe
05/05/2025, 9:30 am EDT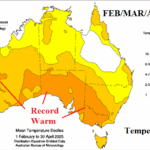
The Power of Marine Heatwaves on Australia Climate
05/09/2025, 6:30 am EDT![]()
Climate Impact Company Daily Feature
Issued: Wednesday, May 7, 2025
Highlight: Fuel for the energetic flooding rainstorms of the past 5 weeks is now diminishing. Major rainfall events diminish after this week’s Southeast rains.
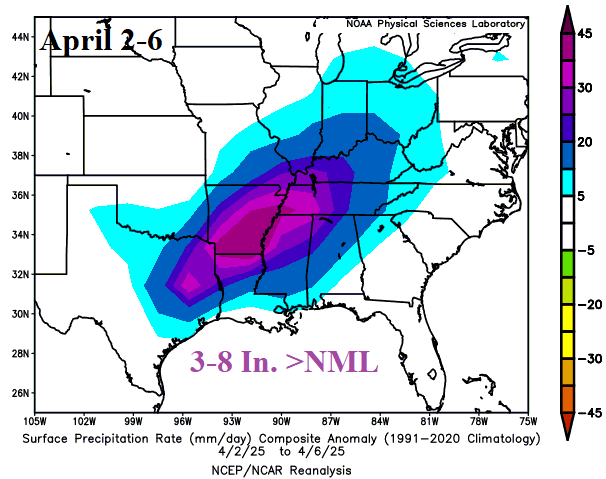
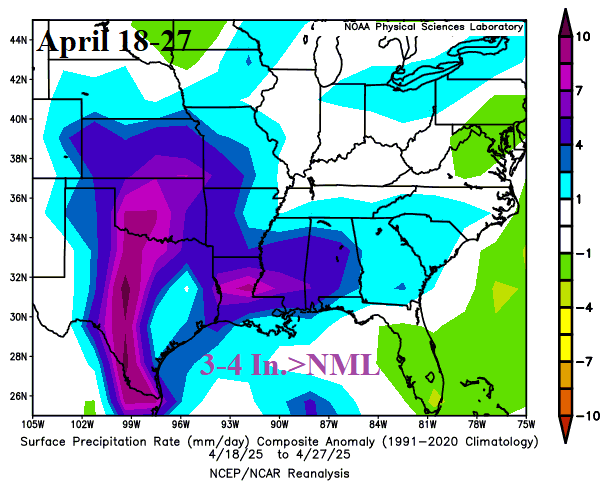
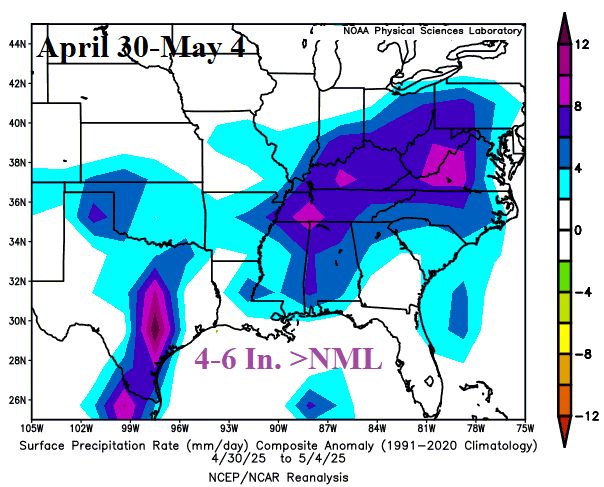
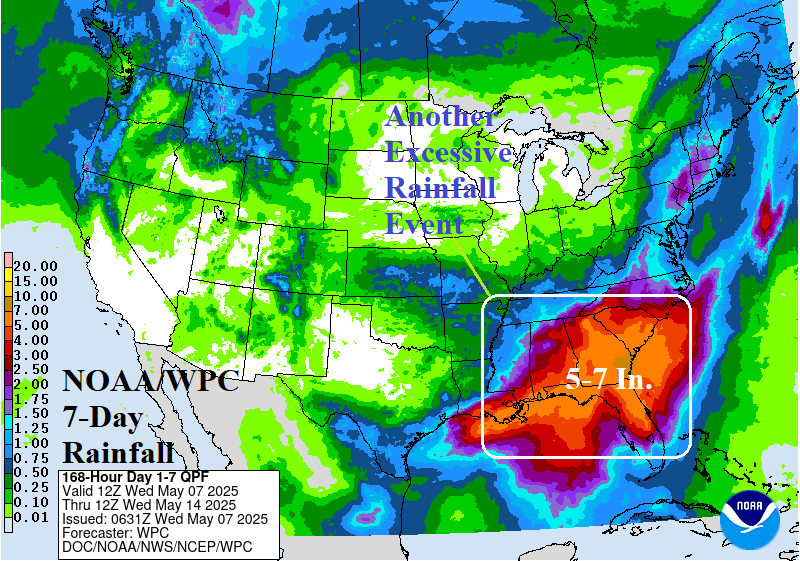
Fig. 1-4: Excessive rainfall leading to flooding events of April 2-6, April 18-27, and early May plus the 7-day rainfall amount forecast from NOAA/WPC.
Discussion: Excessive rainfall events featuring (weekly) departures from normal rainfall of several and up to 8-10 in. began April 2-6 centered on the Mid-south U.S. including the southwest Ohio Valley to eastern Texas (Fig. 1). After a 10+ day dry period, another wet pattern featuring excessive rain evolved over a 10-day period (April 18-27) centered on the southern Great Plains, Texas and Louisiana (Fig. 2). Early May is very wet with heavy rains continuing in Texas and adding the Tennessee Valley to interior Mid-Atlantic States (Fig. 3). The current NOAA/WPC 7-day quantitative precipitation forecast targets the Southeast U.S. and Florida for another excessive rainfall episode (Fig. 4). The culprit has been an energetic upper-level southwest flow carrying moisture from the southeast North Pacific into the Mid-south/East U.S. (Fig. 5) from an area of warm SSTA which has cooled dramatically during this stormy pattern (Fig. 6). Due to the cooling waters in the source region for the energetic U.S. storm pattern of much of the past 5 weeks, after the Southeast U.S. rains of this week/weekend, the excessive wet weather events should ease. Of course, the warmer than normal Gulf of Mexico (Fig. 7) has contributed moisture via a southerly flow around a strong high-pressure area off the U.S. East Coast. However, the northern Gulf of Mexico is cooling significantly (Fig. 8) as upper ocean heat diminishes after entrainment into storms.
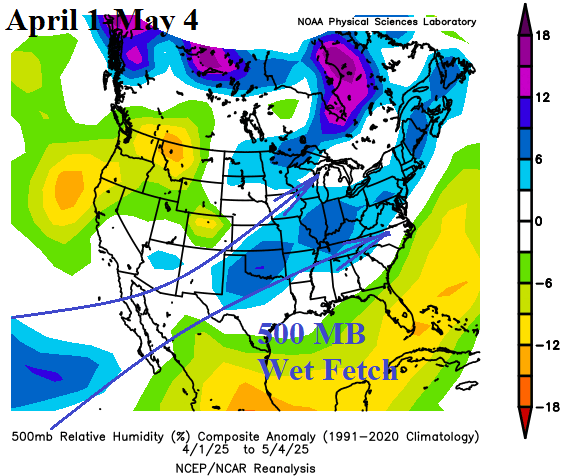
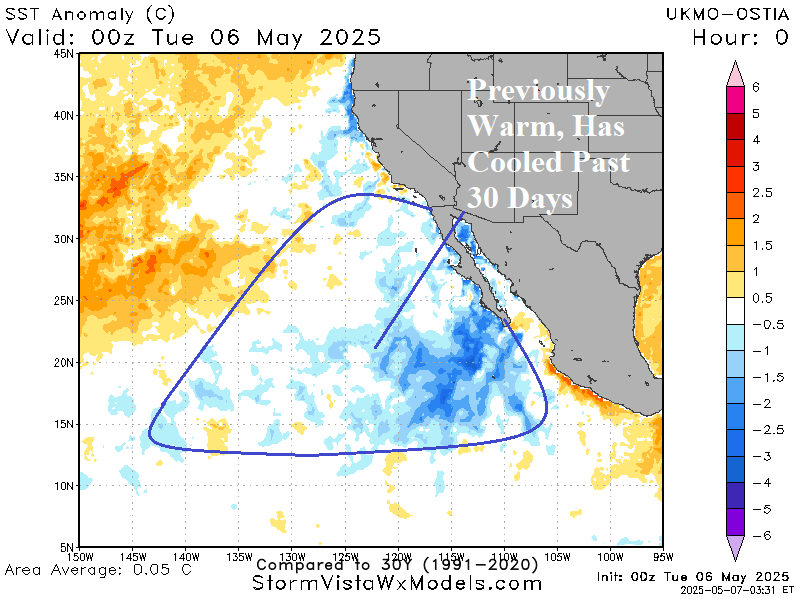
Fig. 5-6: The relative humidity anomalies at 500 MB identify the moisture fetch for the significant rainstorms in the U.S. from the past 5 weeks. The waters southeast of California have cooled significantly after the energetic entrainment of upper ocean heat in this region.
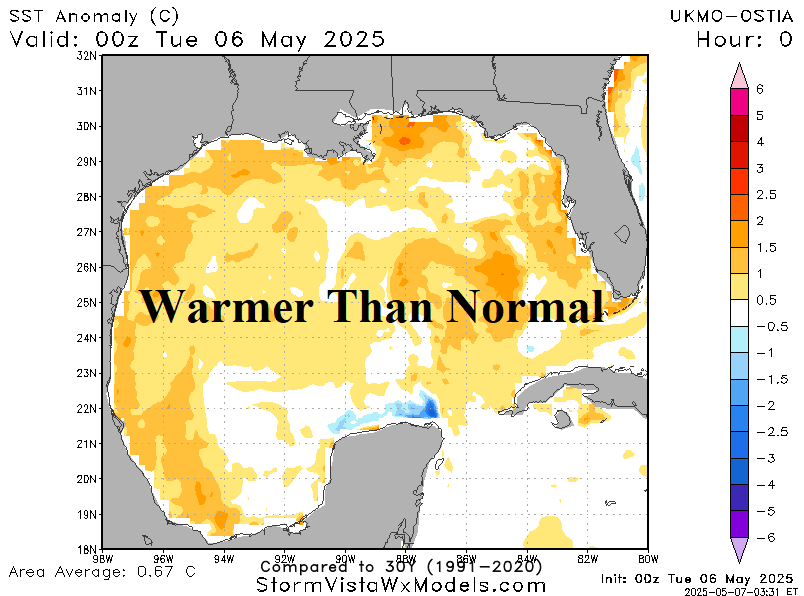
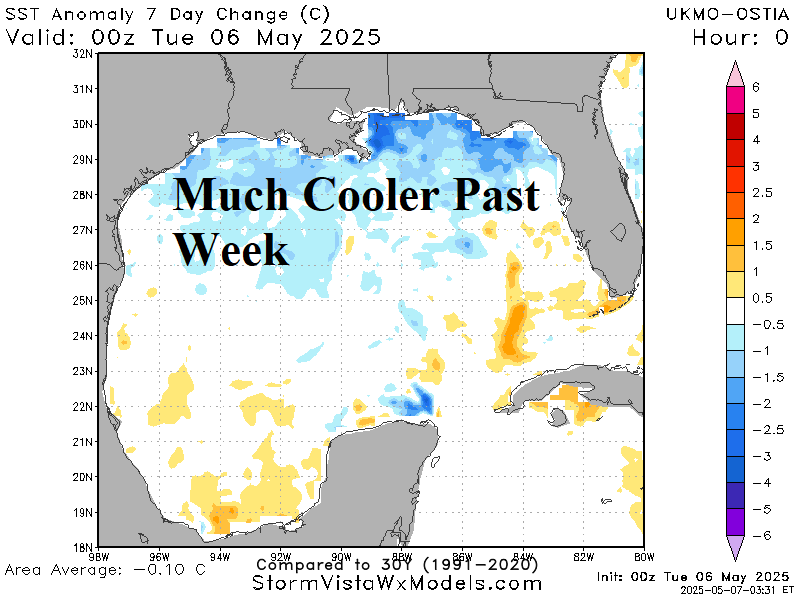
Fig. 7-8: The warmer than normal Gulf of Mexico is losing upper ocean heat across northern portions during the past week due to entrainment into storms.