Sneaky Wet in Northeast Argentina/Southeast Brazil
08/30/2024, 5:56 am EDTU.S. Population Weight CDD’s for Summer 2024
09/04/2024, 10:53 am EDT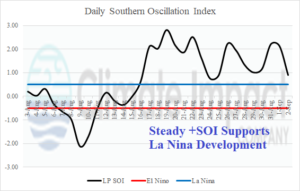
Fig. 1: Finally, steady strong positive phase southern oscillation index develops causing a trend toward La Nina.
Discussion: A steady and intense positive phase of the southern oscillation index (+SOI) has developed since mid-August (Fig. 1) causing trade winds across the eastern equatorial Pacific to increase and begin to up-well cool subsurface water to turn the Nino34, Nino3, and Nino12 SSTA cooler during the past 7-10 days (Fig. 2). The equatorial Pacific upper ocean heat is not impressively cooler than normal although sufficient to cause a weak La Nina to form (Fig. 3) if the up-welling trade winds continue. The Pacific decadal oscillation cool phase, present since 2000, is weaker during recent weeks as the northeast Pacific has warmed. Normally, a warming Northeast Pacific indicates the warm positive phase of PDO. However, nowadays, the West Pacific SSTA is historically warm and when compared to the Northeast Pacific, the warmer west vs. east SSTA supports -PDO (Fig. 4). In our view, this scenario does not truly represent the true PDO pattern. In the North Atlantic, a much warmer than normal basin average maintains persistent warm phase of the Atlantic multidecadal oscillation (AMO) which includes a very warm tropical North Atlantic (TNA) index (Fig. 5). The daily Indian Ocean dipole (IOD) index is in the positive phase (Fig. 6). The Q4/2024 forecast is neutral phase by Australia Bureau of Meteorology and weak negative phase according to the Climate Impact Company constructed analog.
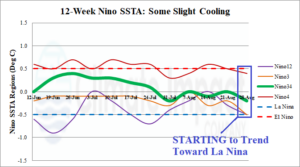
Fig. 2: The weekly Nino SSTA observations (for the past 12 weeks) identify neutral ENSO starting to trend toward La Nina.
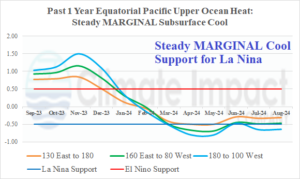
Fig. 3: Subsurface equatorial upper ocean heat is marginally cooler than normal but supportive of La Nina development.
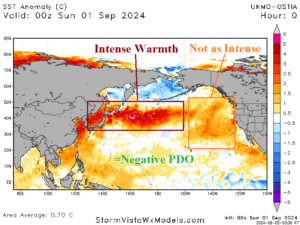
Fig. 4: The North Pacific daily SSTA analysis reveals the Pacific decadal oscillation phase.
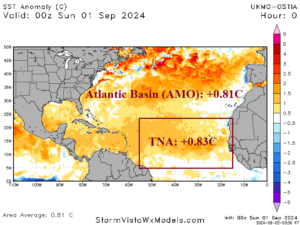
Fig. 5: The North Atlantic daily SSTA reveals the persistent warm phase of the Atlantic multi-decadal oscillation and tropical North Atlantic index.
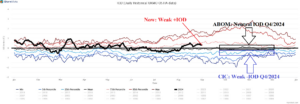
Fig. 6: The daily plot of Indian Ocean dipole compared to recent years and the projected Q4/2024 IOD phase.